Vue3 + Echarts 实现自定义div图例,点击图例触发事件
·
先看效果图:
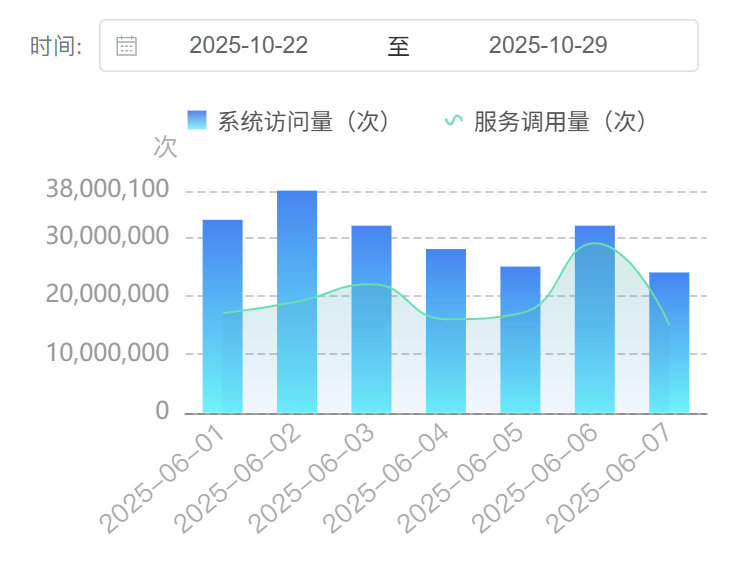
代码实现
template 部分:
<div class="boxMain">
  <div class="queryBox">
    <div class="queryItem">
      <span>时间:</span>
      <el-date-picker
        style="width: 300px;"
        v-model="timeVal"
        type="daterange"
        @change="onTimeValChange"
        placeholder="选择日期"
        value-format="YYYY-MM-DD"
        format="YYYY-MM-DD"
        range-separator="至"
        :clearable="false"
      />
    </div>
  </div>
  <div class="visitBox" id="visitChart"></div>
  <!-- 自定义echarts图例 -->
  <div class="chartLegend">
    <div :class="{ legendItemActive: item.isSelected }" v-for="item in legendArr" :key="item.id" @click="onLegendClick(item)">
      <img :src="item.imgUrl" alt="" />
      <span>{{ item.name }}</span>
    </div>
  </div>
</div>
script 部分:
<script setup>
import { nextTick, onMounted, ref } from 'vue'
import * as echarts from 'echarts'
import $global from '@/utils/globalFun'

onMounted(() => {
  getVisitChartData()
})


const timeVal = ref([])
const onTimeValChange = () => {

}
const visitChartData = ref([])
const getVisitChartData = () => {
  if (timeVal.value.length === 0) {
    const now = new Date()
    const pre = new Date(now.getTime() - 1000 * 3600 * 24 * 7)
    timeVal.value = [
      $global.formatDate(pre, 'yyyy-MM-dd'), // formatDate为自定义的时间格式化方法
      $global.formatDate(now, 'yyyy-MM-dd')
    ]
  }
  const data = [
    { tm: '2025-06-01', num1: 33, num2: 17 },
    { tm: '2025-06-02', num1: 38, num2: 19 },
    { tm: '2025-06-03', num1: 32, num2: 22 },
    { tm: '2025-06-04', num1: 28, num2: 16 },
    { tm: '2025-06-05', num1: 25, num2: 17 },
    { tm: '2025-06-06', num1: 32, num2: 29 },
    { tm: '2025-06-07', num1: 24, num2: 15 }
  ]
  data.forEach(f => {
    f.num1 = f.num1 * 1000000
    f.num2 = f.num2 * 1000000
  })
  visitChartData.value = data
  nextTick(() => {
    drawVisitChart()
  })
}
const drawVisitChart = () => {
  const dom = document.getElementById('visitChart')
  let myChart = echarts.getInstanceByDom(dom)
  if (myChart) { // 如果存在,就清除
    myChart.dispose()
  }
  myChart = echarts.init(dom)
  const option = {
    grid: {
      left: '5%',
      right: '5%',
      bottom: '5%',
      top: '20%',
      containLabel: true
    },
    legend: {
      show: false,
      selected: {
        '系统访问量(次)': true,
        '服务调用量(次)': true
      }
    },
    tooltip: {
      trigger: 'axis',
      axisPointer: {
        type: 'shadow'
      }
    },
    yAxis: {
      name: '次',
      nameTextStyle: {
        color: 'rgba(85,85,85,0.5)',
        padding: [0, 20, 0, 0]
      },
      type: 'value',
      max: function (value) { // 取最大值向上取整为最大刻度
        return value.max < 100 ? 100 : Math.ceil(value.max) + 100
      },
      position: 'top',
      axisLabel: {
        color: '#999'
      },
      axisTick: {
        show: false
      },
      axisLine: {
        show: false
      },
      splitLine: {
        lineStyle: {
          type: 'dashed',
          color: 'rgba(85,85,85,0.3)'
        }
      }
    },
    xAxis: {
      type: 'category',
      data: visitChartData.value.map(m => m.tm),
      axisTick: {
        show: false
      },
      axisLine: {
        lineStyle: {
          type: 'solid',
          color: 'rgba(85,85,85,0.5)'
        }
      },
      axisLabel: {
        interval: 0,
        rotate: 40,
        fontSize: 13,
        color: 'rgba(85,85,85,0.5)'
      }
    },
    series: [
      {
        name: '系统访问量(次)',
        type: 'bar',
        barWidth: 20,
        data: visitChartData.value.map(m => m.num1),
        itemStyle: {
          color: function (params) {
            return new echarts.graphic.LinearGradient(0, 1, 0, 0, [{ offset: 0, color: '#00F7FC' }, { offset: 1, color: '#0089F8' }]) // 颜色渐变显示
          }
        }
      },
      {
        name: '服务调用量(次)',
        type: 'line',
        smooth: true,
        symbol: 'none',
        data: visitChartData.value.map(m => m.num2),
        itemStyle: {
          color: '#38E0AF'
        },
        lineStyle: {
          color: '#38E0AF',
          width: 1
        },
        areaStyle: {
          color: new echarts.graphic.LinearGradient(0, 0, 0, 1, [{ offset: 0, color: 'rgba(72,199,156,0.42)' }, { offset: 1, color: 'rgba(0,137,248,0.1)' }]) // 颜色渐变显示
        }
      }
    ]
  }
  myChart.setOption(option)
}
const legendArr = ref([
  { id: 1, name: '系统访问量(次)', isSelected: true, imgUrl: $global.getAssetsImages('datahub/icon_visit.png') },
  { id: 2, name: '服务调用量(次)', isSelected: true, imgUrl: $global.getAssetsImages('datahub/icon_interface.png') }
])
const onLegendClick = (item) => {
  // 切换选中状态
  const obj = legendArr.value.find(f => f.id === item.id)
  obj.isSelected = !obj.isSelected
  // 更新图表配置
  const legendMap = {}
  legendArr.value.forEach(el => {
    legendMap[el.name] = el.isSelected
  })
  const myChart = echarts.getInstanceByDom(document.getElementById('visitChart'))
  if (myChart) {
    myChart.setOption({
      legend: {
        selected: legendMap
      }
    })
  }
}

</script>
css 部分:
<style lang="scss" scoped>
.boxMain {
  height: 320px;
  position: relative;
  .queryBox {
    height: 40px;
    display: flex;
    align-items: center;
    .queryItem {
      display: flex;
      align-items: center;
      span {
        padding: 0 10px;
        font-size: 14px;
        color: rgba(85, 85, 85, 0.8);
      }
    }
  }
  .visitBox {
    width: 100%;
    height: calc(100% - 50px);
    margin-top: 10px;
  }
  .chartLegend {
    height: 30px;
    position: absolute;
    top: 60px;
    right: 60px;
    display: flex;
    align-items: center;
    & > div {
      margin-right: 25px;
      cursor: pointer;
      display: flex;
      align-items: center;
      opacity: 0.5;
      img {
        height: 12px;
        margin-right: 6px;
      }
      span {
        font-size: 14px;
        color: #555;
      }
    }
    & > div:nth-last-of-type(1) {
      margin-right: 0;
    }
    .legendItemActive {
      opacity: 1;
    }
  }
}
</style>
其他:
图片素材 

/utils/globalFun.js 代码如下:
const $global = {
  /**
   * 引入本地静态图片
   */
  getAssetsImages (url, otherUrl) {
    if (otherUrl) {
      return new URL(`/src/${otherUrl}`, import.meta.url).href
    }
    return new URL(`/src/assets/imgs/${url}`, import.meta.url).href
  },
  /**
   * 把一个js日期类型参数转换成 'yyyy-mm-dd' 格式字符串
   * @param {string} format 日期格式或者Date对象, 如: yyyy-MM-dd HH:mm:ss
   */
  formatDate (date, format = 'yyyy-MM-dd') {
    if (!date || ['', '-'].includes(date)) return date

    // 如果 date 是字符串,转换为 Date 对象
    if (typeof date === 'string') date = new Date(date)

    const pad = (num, length = 2) => num.toString().padStart(length, '0')
    const { getDate: day, getMonth: month, getFullYear: year, getHours: hours, getMinutes: minutes, getSeconds: seconds } = date

    const replacements = {
      yyyy: year.call(date),
      yy: year.call(date).toString().slice(-2),
      MM: pad(month.call(date) + 1),
      dd: pad(day.call(date)),
      HH: pad(hours.call(date)),
      hh: pad(hours.call(date) % 12 || 12),
      mm: pad(minutes.call(date)),
      ss: pad(seconds.call(date)),
      t: hours.call(date) >= 12 ? 'pm' : 'am'
    }

    return format.replace(/yyyy|yy|MM|dd|HH|hh|mm|ss|t/g, (match) => replacements[match])
  }
}

export default $global

Agent 垂直技术社区,欢迎活跃、内容共建。
更多推荐


 13
13 0
0- 0


 已为社区贡献7条内容

所有评论(0)