Python & MATLAB 绘制和弦图,一图看懂实体关系
·
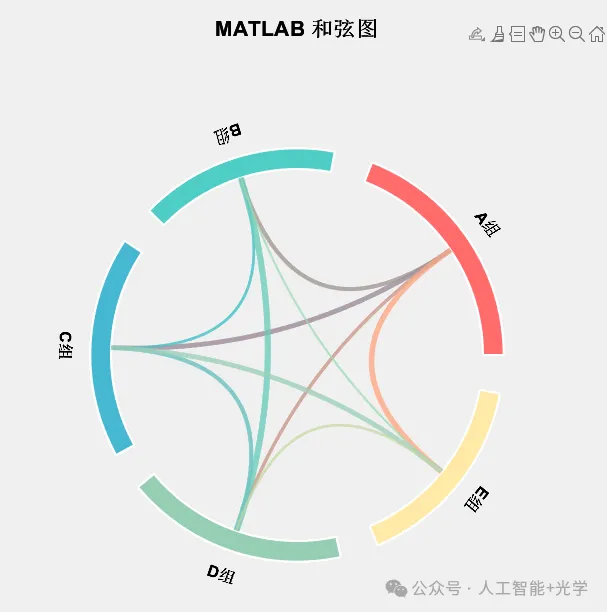
 二、Matlab绘制和弦图
function chord_diagram()
    % 和弦图绑制

    % 数据矩阵(对称矩阵)
    matrix = [
        0, 5, 6, 4, 7;
        5, 0, 3, 8, 2;
        6, 3, 0, 5, 6;
        4, 8, 5, 0, 3;
        7, 2, 6, 3, 0
    ];

    labels = {'A组', 'B组', 'C组', 'D组', 'E组'};
    colors = [
        255, 107, 107;
        78, 205, 196;
        69, 183, 209;
        150, 206, 180;
        255, 234, 167
    ] / 255;

    n = size(matrix, 1);

    % 创建图形
    figure('Position', [100, 100, 800, 800]);
    hold on;
    axis equal;
    axis off;

    % 计算每个节点的角度分配
    totals = sum(matrix, 1) + sum(matrix, 2)';
    total_sum = sum(totals);

    gap = 0.03 * 2 * pi;  % 间隙
    available = 2 * pi - n * gap;

    angles = zeros(n, 2);  % [起始角, 结束角]
    start_angle = 0;

    for i = 1:n
        extent = (totals(i) / total_sum) * available;
        angles(i, :) = [start_angle, start_angle + extent];
        start_angle = start_angle + extent + gap;
    end

    radius = 1.0;
    inner_radius = 0.9;

    % 绘制外圈弧形
    for i = 1:n
        theta = linspace(angles(i,1), angles(i,2), 100);

        % 外弧
        x_outer = radius * cos(theta);
        y_outer = radius * sin(theta);

        % 内弧(反向)
        x_inner = inner_radius * cos(fliplr(theta));
        y_inner = inner_radius * sin(fliplr(theta));

        % 填充区域
        x = [x_outer, x_inner, x_outer(1)];
        y = [y_outer, y_inner, y_outer(1)];

        fill(x, y, colors(i,:), 'EdgeColor', 'white', 'LineWidth', 1.5);

        % 添加标签
        mid_angle = (angles(i,1) + angles(i,2)) / 2;
        label_radius = radius + 0.12;

        % 计算旋转角度
        rot_angle = rad2deg(mid_angle);
        if rot_angle > 90 && rot_angle < 270
            rot_angle = rot_angle + 180;
        end

        text(label_radius * cos(mid_angle), label_radius * sin(mid_angle), ...
            labels{i}, 'HorizontalAlignment', 'center', ...
            'FontSize', 12, 'FontWeight', 'bold', ...
            'Rotation', rot_angle - 90);
    end

    % 绘制和弦(贝塞尔曲线连接)
    for i = 1:n
        for j = i+1:n
            if matrix(i,j) > 0
                % 计算起终点
                angle_i = mean(angles(i,:));
                angle_j = mean(angles(j,:));

                x1 = inner_radius * cos(angle_i);
                y1 = inner_radius * sin(angle_i);
                x2 = inner_radius * cos(angle_j);
                y2 = inner_radius * sin(angle_j);

                % 贝塞尔曲线
                t = linspace(0, 1, 100);
                % 二次贝塞尔曲线,控制点在原点
                x_curve = (1-t).^2 * x1 + 2*(1-t).*t * 0 + t.^2 * x2;
                y_curve = (1-t).^2 * y1 + 2*(1-t).*t * 0 + t.^2 * y2;

                % 线宽与权重成比例
                lw = 0.5 + matrix(i,j) * 0.5;

                % 混合颜色
                mixed_color = (colors(i,:) + colors(j,:)) / 2;

                plot(x_curve, y_curve, 'Color', [mixed_color, 0.6], ...
                    'LineWidth', lw);
            end
        end
    end

    xlim([-1.5, 1.5]);
    ylim([-1.5, 1.5]);
    title('MATLAB 和弦图', 'FontSize', 16, 'FontWeight', 'bold');

    hold off;
end
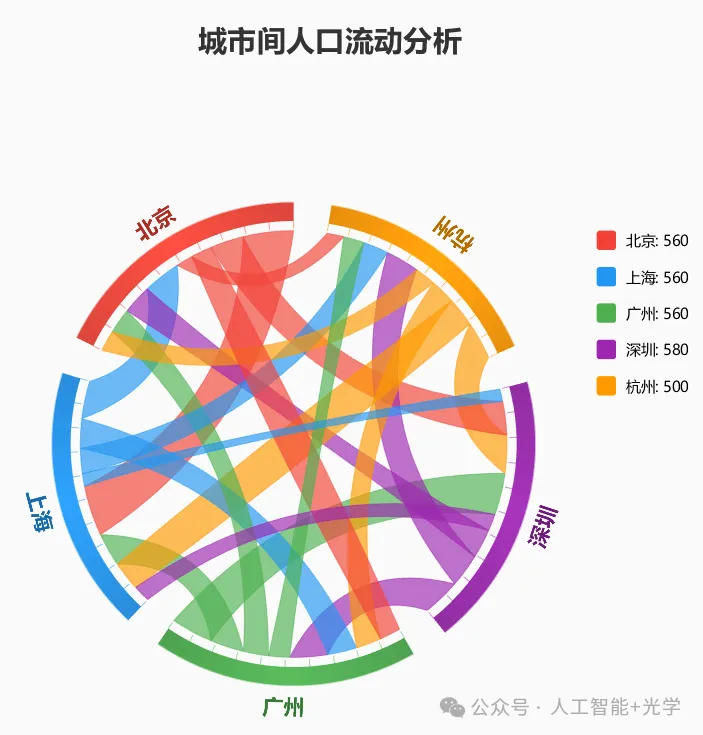
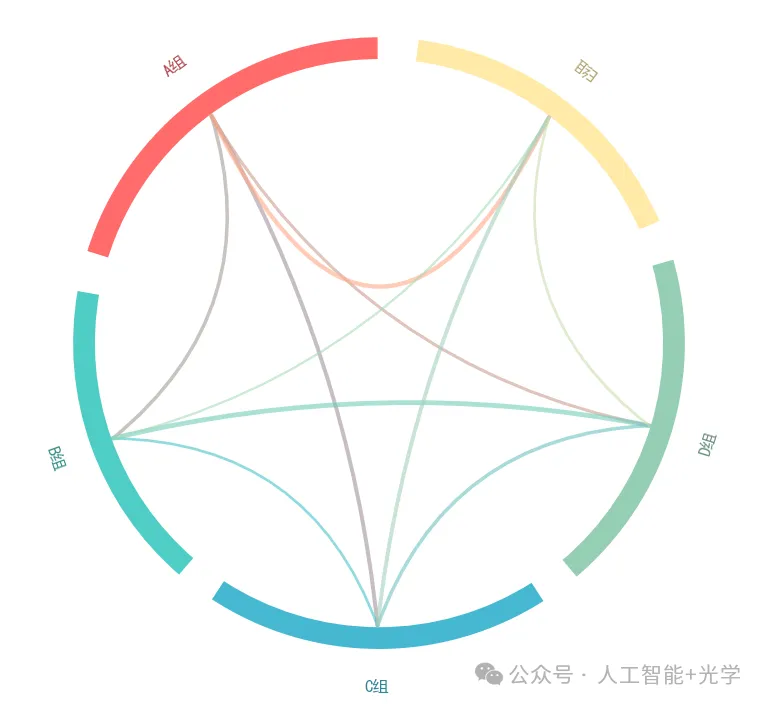
三、Python绘制和弦图
import numpy as np
import matplotlib.pyplot as plt
from matplotlib.path import Path
import matplotlib.patches as mpatches
def hex_to_rgb(hex_color):
    hex_color = hex_color.lstrip('#')
    return tuple(int(hex_color[i:i+2], 16) / 255.0 for i in (0, 2, 4))
def ensure_rgb(color):
    if isinstance(color, str):
        return hex_to_rgb(color)
    elif isinstance(color, (list, tuple)):
        if any(c > 1 for c in color[:3]):
            return tuple(c / 255.0 for c in color[:3])
        return tuple(color[:3])
    return color
def chord_diagram(matrix, names, colors=None, ax=None):
    n = len(matrix)

    # 处理颜色
    if colors is None:
        cmap = plt.cm.get_cmap('Set3')
        colors_rgb = [cmap(i / n)[:3] for i in range(n)]
    else:
        colors_rgb = [ensure_rgb(c) for c in colors]

    if ax is None:
        fig, ax = plt.subplots(figsize=(10, 10))

    # 计算每个节点的总权重
    row_sums = np.sum(matrix, axis=1)
    col_sums = np.sum(matrix, axis=0)
    totals = row_sums + col_sums
    total_sum = np.sum(totals)

    # 设置间隙
    gap = 0.02 * 2 * np.pi
    available = 2 * np.pi - n * gap

    # 计算每个节点的角度范围
    angles = []
    start = np.pi / 2
    for i in range(n):
        extent = (totals[i] / total_sum) * available
        angles.append((start, start + extent))
        start += extent + gap

    # 半径设置
    radius = 1.0
    width = 0.08
    inner_radius = radius - width

    for i in range(n):
        theta1, theta2 = np.degrees(angles[i][0]), np.degrees(angles[i][1])
        arc = mpatches.Wedge(
            center=(0, 0),
            r=radius,
            theta1=theta1,
            theta2=theta2,
            width=width,
            facecolor=colors_rgb[i],
            edgecolor='white',
            linewidth=2
        )
        ax.add_patch(arc)

        # 添加标签
        mid_angle = (angles[i][0] + angles[i][1]) / 2
        label_radius = radius + 0.12
        x = label_radius * np.cos(mid_angle)
        y = label_radius * np.sin(mid_angle)

        # 调整文字旋转角度
        rotation = np.degrees(mid_angle) - 90
        if rotation > 90:
            rotation -= 180
        elif rotation < -90:
            rotation += 180

        ax.text(x, y, names[i],
                ha='center', va='center',
                fontsize=12, fontweight='bold',
                rotation=rotation,
                color=tuple(c * 0.7 for c in colors_rgb[i]))  # 深色标签

    for i in range(n):
        for j in range(i+1, n):
            if matrix[i][j] > 0 or matrix[j][i] > 0:
                strength = (matrix[i][j] + matrix[j][i]) / total_sum

                # 起点
                angle_i = (angles[i][0] + angles[i][1]) / 2
                x1 = inner_radius * np.cos(angle_i)
                y1 = inner_radius * np.sin(angle_i)

                # 终点
                angle_j = (angles[j][0] + angles[j][1]) / 2
                x2 = inner_radius * np.cos(angle_j)
                y2 = inner_radius * np.sin(angle_j)

                # 控制点(向圆心方向弯曲)
                mid_angle = (angle_i + angle_j) / 2
                dist = np.sqrt((x2-x1)**2 + (y2-y1)**2)
                ctrl_r = max(0.1, inner_radius * (1 - dist / (2 * inner_radius)))
                cx = ctrl_r * np.cos(mid_angle)
                cy = ctrl_r * np.sin(mid_angle)

                # 贝塞尔曲线
                verts = [
                    (x1, y1),
                    (cx, cy),
                    (x2, y2),
                ]
                codes = [Path.MOVETO, Path.CURVE3, Path.CURVE3]
                path = Path(verts, codes)

                # 混合两个节点的颜色
                mixed_color = tuple(
                    (colors_rgb[i][k] + colors_rgb[j][k]) / 2
                    for k in range(3)
                )

                patch = mpatches.PathPatch(
                    path,
                    facecolor='none',
                    edgecolor=mixed_color,
                    linewidth=1 + strength * 30,
                    alpha=0.6,
                    capstyle='round'
                )
                ax.add_patch(patch)

    ax.set_xlim(-1.5, 1.5)
    ax.set_ylim(-1.5, 1.5)
    ax.set_aspect('equal')
    ax.axis('off')

    return ax

if __name__ == "__main__":

    plt.rcParams['font.sans-serif'] = ['SimHei', 'Microsoft YaHei', 'Arial Unicode MS']
    plt.rcParams['axes.unicode_minus'] = False


    matrix = np.array([
        [0, 5, 6, 4, 7],
        [5, 0, 3, 8, 2],
        [6, 3, 0, 5, 6],
        [4, 8, 5, 0, 3],
        [7, 2, 6, 3, 0]
    ])

    names = ['A组', 'B组', 'C组', 'D组', 'E组']
    colors_hex = ['#FF6B6B', '#4ECDC4', '#45B7D1', '#96CEB4', '#FFEAA7']
    colors_rgb = [
        (0.95, 0.26, 0.21),
        (0.13, 0.59, 0.95),
        (0.30, 0.69, 0.31),
        (0.61, 0.15, 0.69),
        (1.00, 0.60, 0.00)
    ]
    colors_255 = [
        (255, 107, 107),
        (78, 205, 196),
        (69, 183, 209),
        (150, 206, 180),
        (255, 234, 167)
    ]
    colors = colors_hex
    fig, ax = plt.subplots(figsize=(10, 10), facecolor='white')
    chord_diagram(matrix, names, colors, ax)

    plt.title('和弦图示例', fontsize=18, fontweight='bold', pad=20)
    plt.tight_layout()
    plt.savefig('chord_diagram.png', dpi=150, bbox_inches='tight', facecolor='white')
    plt.show()

Agent 垂直技术社区,欢迎活跃、内容共建。
更多推荐


 1
1 0
0- 0


 已为社区贡献12条内容

所有评论(0)