Python绘制相交平面
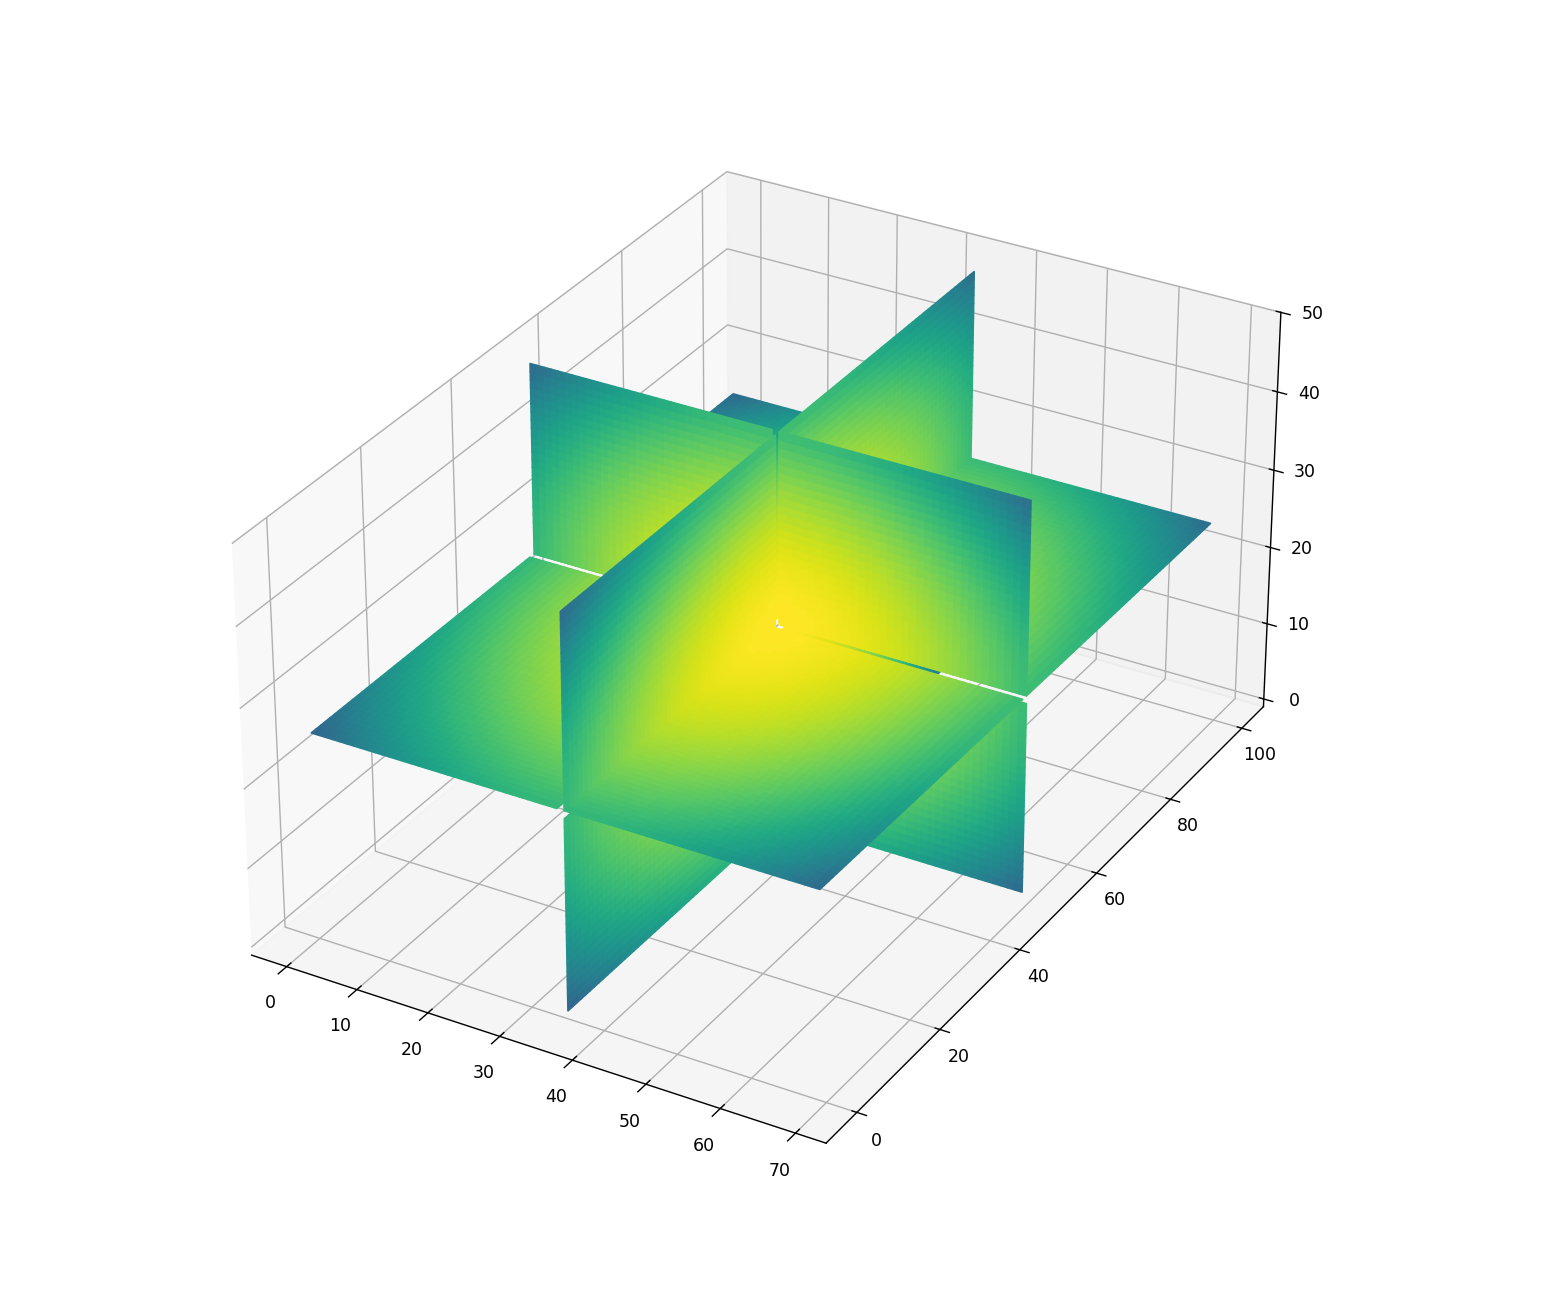
该示例演示了在3D中绘制相交平面。这是二维图像到三维的一般化。
在mplot3d中绘制相交平面比较复杂,因为mplot3d并不是真正的3D渲染器,它只是将艺术家(Artists)投影到3D中并按正确的顺序绘制它们。如果艺术家彼此重叠,这种方法就不能正确工作。在此示例中,我们通过在平面交点处分段来解决相互重叠的问题,将每个平面分成四部分。
该示例仅在平面相互平分切割时能够正确工作。这个限制是有意为之,以保持代码更易读。虽然在任意位置切割平面是可能的,但会使代码更加复杂。因此,该示例更多是展示如何绕过3D可视化限制的概念,而不是一个可以直接复制粘贴用于绘制任意相交平面的完善解决方案。
import matplotlib.pyplot as plt
import numpy as np
def plot_quadrants(ax, array, fixed_coord, cmap):
"""For a given 3d *array* plot a plane with *fixed_coord*, using four quadrants."""
nx, ny, nz = array.shape
index = {
'x': (nx // 2, slice(None), slice(None)),
'y': (slice(None), ny // 2, slice(None)),
'z': (slice(None), slice(None), nz // 2),
}[fixed_coord]
plane_data = array[index]
n0, n1 = plane_data.shape
quadrants = [
plane_data[:n0 // 2, :n1 // 2],
plane_data[:n0 // 2, n1 // 2:],
plane_data[n0 // 2:, :n1 // 2],
plane_data[n0 // 2:, n1 // 2:]
]
min_val = array.min()
max_val = array.max()
cmap = plt.get_cmap(cmap)
for i, quadrant in enumerate(quadrants):
facecolors = cmap((quadrant - min_val) / (max_val - min_val))
if fixed_coord == 'x':
Y, Z = np.mgrid[0:ny // 2, 0:nz // 2]
X = nx // 2 * np.ones_like(Y)
Y_offset = (i // 2) * ny // 2
Z_offset = (i % 2) * nz // 2
ax.plot_surface(X, Y + Y_offset, Z + Z_offset, rstride=1, cstride=1,
facecolors=facecolors, shade=False)
elif fixed_coord == 'y':
X, Z = np.mgrid[0:nx // 2, 0:nz // 2]
Y = ny // 2 * np.ones_like(X)
X_offset = (i // 2) * nx // 2
Z_offset = (i % 2) * nz // 2
ax.plot_surface(X + X_offset, Y, Z + Z_offset, rstride=1, cstride=1,
facecolors=facecolors, shade=False)
elif fixed_coord == 'z':
X, Y = np.mgrid[0:nx // 2, 0:ny // 2]
Z = nz // 2 * np.ones_like(X)
X_offset = (i // 2) * nx // 2
Y_offset = (i % 2) * ny // 2
ax.plot_surface(X + X_offset, Y + Y_offset, Z, rstride=1, cstride=1,
facecolors=facecolors, shade=False)
def figure_3D_array_slices(array, cmap=None):
"""Plot a 3d array using three intersecting centered planes."""
fig = plt.figure()
ax = fig.add_subplot(projection='3d')
ax.set_box_aspect(array.shape)
plot_quadrants(ax, array, 'x', cmap=cmap)
plot_quadrants(ax, array, 'y', cmap=cmap)
plot_quadrants(ax, array, 'z', cmap=cmap)
return fig, ax
nx, ny, nz = 70, 100, 50
r_square = (np.mgrid[-1:1:1j * nx, -1:1:1j * ny, -1:1:1j * nz] ** 2).sum(0)
figure_3D_array_slices(r_square, cmap='viridis_r')
plt.show()
参考文献:https://matplotlib.org/stable/gallery/mplot3d/intersecting_planes.html

Agent 垂直技术社区,欢迎活跃、内容共建。
更多推荐


 9
9 0
0- 0



 已为社区贡献4条内容

所有评论(0)