基于 PySide6 实现一个可手动绘制的深度学习热力图 UI,效果类似 Grad-CAM
·
一、简介
最近在做深度学习中的热力图效果可视化时,我一开始是想通过 Grad-CAM 输出模型关注区域,但效果很差,难以应用在论文、课程设计中的效果图展示。因此,我希望能手动绘制热力图区域,并且渲染效果接近 Grad-CAM 的伪彩色热图。于是我用 PySide6 + NumPy 做了一个小工具,支持加载图片、手动涂抹热区、实时生成类似 Grad-CAM 的热力图叠加效果,同时还能导出结果图,以支持科研绘图。
二、原理
虽然这不是模型真正计算出来的 Grad-CAM,但显示思路非常接近,用户在图像上手动绘制一个灰度热度图 heat,然后对 heat 做高斯模糊使热度扩散更自然,进一步将归一化后的热度映射到 JET 伪彩色再与原图做 alpha blending 叠加,最终显示效果就会比较接近常见的 Grad-CAM 可视化结果。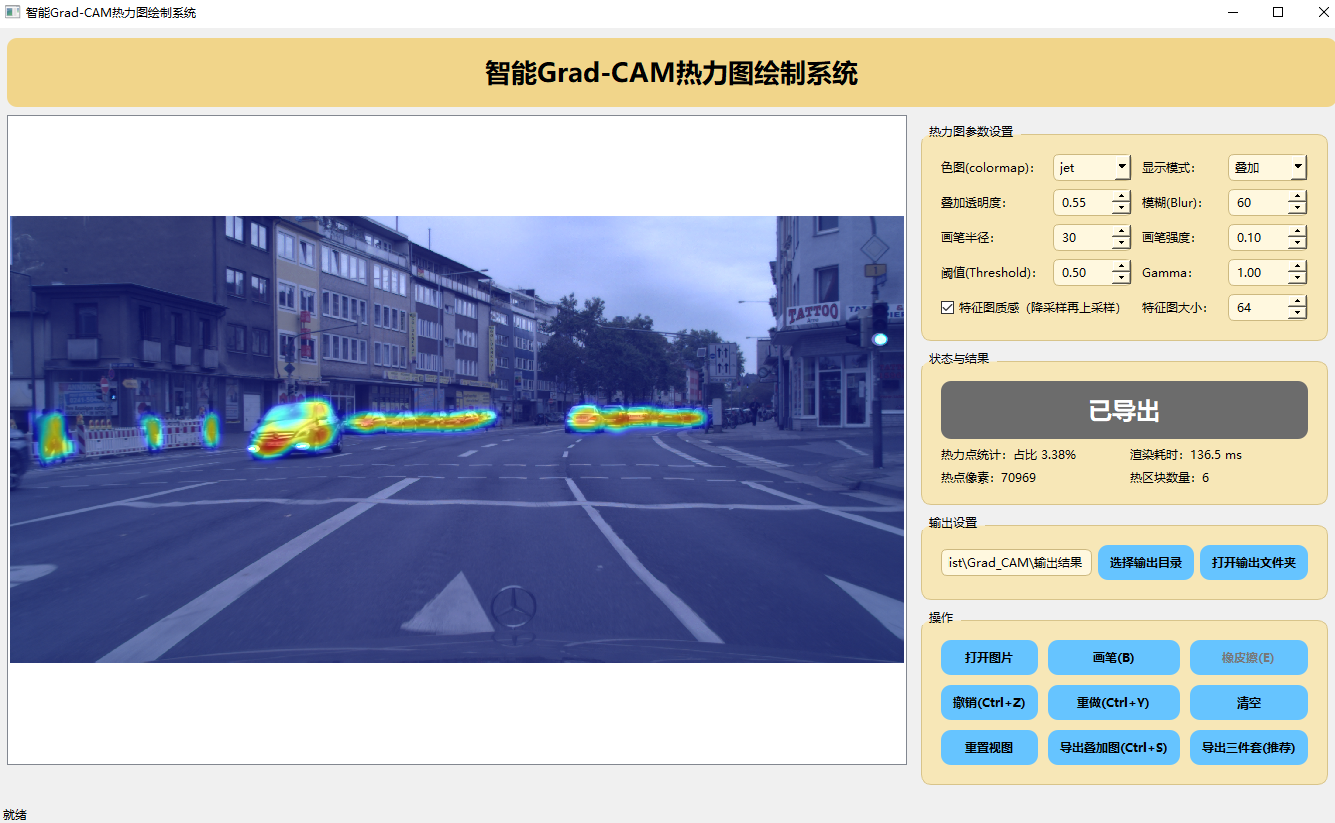
三、关键问题与踩坑记录
在开发过程中,我遇到了几个比较典型的问题。
def _widget_pos_to_image_xy(self, pos: QPoint) -> tuple[int, int] | None:
运行后报错:
TypeError: 'type' object is not subscriptable
这是因为当前环境中的 Python 版本较低,不支持:tuple[int, int]与| None
改成兼容写法:
from typing import Optional, Tuple
def _widget_pos_to_image_xy(self, pos: QPoint) -> Optional[Tuple[int, int]]:
四、代码
import numpy as np
import cv2

def build_jet_lut(n=256):
    x = np.linspace(0, 1, n)
    r = np.clip(1.5 - np.abs(4 * x - 3), 0, 1)
    g = np.clip(1.5 - np.abs(4 * x - 2), 0, 1)
    b = np.clip(1.5 - np.abs(4 * x - 1), 0, 1)
    lut = np.stack([r, g, b], axis=1)
    return (lut * 255).astype(np.uint8)

JET_LUT = build_jet_lut(256)

def apply_colormap_jet(gray01):
    idx = np.clip((gray01 * 255.0).round().astype(np.int32), 0, 255)
    return JET_LUT[idx]

def make_brush(radius):
    yy, xx = np.mgrid[-radius:radius + 1, -radius:radius + 1].astype(np.float32)
    dist2 = xx * xx + yy * yy
    sigma = max(1.0, radius / 2.5)
    brush = np.exp(-dist2 / (2 * sigma * sigma))
    brush /= (brush.max() + 1e-8)
    return brush.astype(np.float32)

def dab_heatmap(heat, x, y, radius=30, strength=0.35):
    h, w = heat.shape
    brush = make_brush(radius)

    x0, x1 = x - radius, x + radius + 1
    y0, y1 = y - radius, y + radius + 1

    sx0, sy0 = 0, 0
    sx1, sy1 = brush.shape[1], brush.shape[0]

    if x0 < 0:
        sx0 = -x0
        x0 = 0
    if y0 < 0:
        sy0 = -y0
        y0 = 0
    if x1 > w:
        sx1 -= (x1 - w)
        x1 = w
    if y1 > h:
        sy1 -= (y1 - h)
        y1 = h

    if x0 >= x1 or y0 >= y1:
        return heat

    patch = brush[sy0:sy1, sx0:sx1] * strength
    heat[y0:y1, x0:x1] += patch
    heat[y0:y1, x0:x1] = np.clip(heat[y0:y1, x0:x1], 0.0, 10.0)
    return heat

def render_heatmap_overlay(image_rgb, heat, blur_sigma=8, alpha=0.55):
    heat_blur = cv2.GaussianBlur(heat, (0, 0), sigmaX=blur_sigma, sigmaY=blur_sigma)

    p = np.percentile(heat_blur, 99.0) if heat_blur.max() > 1e-8 else 0.0
    denom = max(p, 1e-8)
    heat01 = np.clip(heat_blur / denom, 0.0, 1.0)

    colored = apply_colormap_jet(heat01)

    base = image_rgb.astype(np.float32) / 255.0
    col = colored.astype(np.float32) / 255.0
    blended = np.clip((1 - alpha) * base + alpha * col, 0.0, 1.0)

    return (blended * 255.0).astype(np.uint8)
五、总结
本文实现了一个基于 PySide6 的手动热力图绘制工具,虽然不是深度学习神经网络模型真实计算出来的类激活Grad-CAM,但在视觉效果上已经比较接近,并且具备很强的交互性和可控性。相比直接依赖模型可视化,这种方式更适合手工标注关注区域,制作演示图和论文实验效果图。

Agent 垂直技术社区,欢迎活跃、内容共建。
更多推荐


 13
13 0
0- 0


 已为社区贡献4条内容

所有评论(0)