vue3+echarts3D饼状图和柱状图
·
1.饼状图环状图的实现
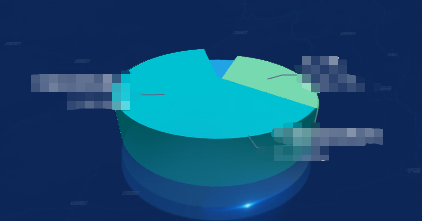
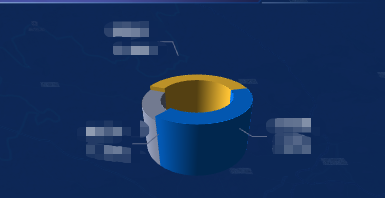
pieChart.js文件
/**
 * 绘制3d图
 * @param pieData 总数据
 * @param internalDiameterRatio:透明的空心占比
 * @param distance 视角到主体的距离
 * @param alpha 旋转角度
 * @param pieHeight 立体的高度
 * @param opacity 饼或者环的透明度
 * @param colors
 */
const getPie3D = (pieData, internalDiameterRatio, distance, alpha, pieHeight, opacity = 1,colors = []) => {
  const series = []
  let sumValue = 0
  let startValue = 0
  let endValue = 0
  let legendData = []
  let legendBfb = []
  const k = 1 - internalDiameterRatio
  pieData.sort((a, b) => {
    return b.value - a.value
  })
  // 为每一个饼图数据,生成一个 series-surface 配置
  for (let i = 0; i < pieData.length; i++) {
    sumValue += pieData[i].value
    const seriesItem = {
      name: typeof pieData[i].name === 'undefined' ?
        `series${i}` :
        pieData[i].name,
      type: 'surface',
      parametric: true,
      wireframe: {
        show: false
      },
      pieData: pieData[i],
      pieStatus: {
        selected: false,
        hovered: false,
        k: k
      },
      center: ['10%', '50%']
    }
    if (typeof pieData[i].itemStyle !== 'undefined') {
      const itemStyle = {}
      itemStyle.color =
        typeof pieData[i].itemStyle.color !== 'undefined' ?
        pieData[i].itemStyle.color :
        opacity
      itemStyle.opacity =
        typeof pieData[i].itemStyle.opacity !== 'undefined' ?
        pieData[i].itemStyle.opacity :
        opacity
      seriesItem.itemStyle = itemStyle
    }
    series.push(seriesItem)


     // 使用传入的颜色数组设置颜色
    if (colors && colors.length > 0) {
      const itemStyle = {
        color: colors[i % colors.length],
        opacity: typeof pieData[i].itemStyle?.opacity !== 'undefined' ?
                pieData[i].itemStyle.opacity : opacity
      };
      seriesItem.itemStyle = itemStyle;
    } else if (typeof pieData[i].itemStyle !== 'undefined') {
      // 保留原来的处理逻辑
      const itemStyle = {}
      itemStyle.color = typeof pieData[i].itemStyle.color !== 'undefined' ?
                       pieData[i].itemStyle.color : opacity;
      itemStyle.opacity = typeof pieData[i].itemStyle.opacity !== 'undefined' ?
                         pieData[i].itemStyle.opacity : opacity;
      seriesItem.itemStyle = itemStyle;
    } else {
      // 没有指定颜色时的默认处理
      seriesItem.itemStyle = { opacity };

    }


  }

  // 使用上一次遍历时,计算出的数据和 sumValue,调用 getParametricEquation 函数,
  // 向每个 series-surface 传入不同的参数方程 series-surface.parametricEquation,也就是实现每一个扇形。
  legendData = []
  legendBfb = []
  for (let i = 0; i < series.length; i++) {
    endValue = startValue + series[i].pieData.value
    series[i].pieData.startRatio = startValue / sumValue
    series[i].pieData.endRatio = endValue / sumValue
    series[i].parametricEquation = getParametricEquation(
      series[i].pieData.startRatio,
      series[i].pieData.endRatio,
      false,
      false,
      k,
      series[i].pieData.value
    )
    startValue = endValue
    const bfb = fomatFloat(series[i].pieData.value / sumValue, 4)
    legendData.push({
      name: series[i].name,
      value: bfb
    })
    legendBfb.push({
      name: series[i].name,
      value: bfb
    })
  }
  const boxHeight = getHeight3D(series, pieHeight) // 通过pieHeight设定3d饼/环的高度,单位是px
  // 准备待返回的配置项,把准备好的 legendData、series 传入。
  const option = {


    legend: {
      show: false,
      data: legendData,
      orient: 'vertical',
      left: 10,
      top: 10,
      itemGap: 10,
      textStyle: {
        color: '#093042ff',
        // fontSize: '90px',
      },
      icon: 'circle',
      formatter: function (param) {
        const item = legendBfb.filter(item => item.name === param)[0]
        const bfs = fomatFloat(item.value * 100, 2) + '%'
        return `${item.name}  ${bfs}`
      }
    },
    labelLine: {
      show: true,
      lineStyle: {
        color: '#5c6887'
      }
    },
    label: {
      show: true,
      position: 'outside',
      formatter: '{b} \n{c} {d}%'
    },
    tooltip: {
      backgroundColor: '#073b72ff',
      borderColor: '#21f2c4',
      textStyle: {
        color: '#00d7e9',
        fontSize: 13
      },
      formatter: params => {
        if (
          params.seriesName !== 'mouseoutSeries' &&
          params.seriesName !== 'pie2d'
        ) {
          const bfb = (
            (option.series[params.seriesIndex].pieData.endRatio -
              option.series[params.seriesIndex].pieData.startRatio) *
            100
          ).toFixed(2)
          return (
            `${params.seriesName}<br/>` +
            `<span style="display:inline-block;margin-right:5px;border-radius:10px;width:10px;height:10px;background-color:${params.color};"></span>` +
            `${bfb}%`
          )
        }
      }
    },
    xAxis3D: {
      min: -1,
      max: 1
    },
    yAxis3D: {
      min: -1,
      max: 1
    },
    zAxis3D: {
      min: -1,
      max: 1
    },
    grid3D: {
      show: false,
      boxHeight: boxHeight, // 圆环的高度
      viewControl: {

        alpha,
        distance,
        rotateSensitivity: 0,
        zoomSensitivity: 0,
        panSensitivity: 0,
        autoRotate: true
      }
    },
    series: series
  }
  return option
}

/**
 * 生成扇形的曲面参数方程,用于 series-surface.parametricEquation
 */
const getParametricEquation = (startRatio, endRatio, isSelected, isHovered, k, h) => {
  // 计算
  const midRatio = (startRatio + endRatio) / 2
  const startRadian = startRatio * Math.PI * 2
  const endRadian = endRatio * Math.PI * 2
  const midRadian = midRatio * Math.PI * 2
  // 如果只有一个扇形,则不实现选中效果。
  if (startRatio === 0 && endRatio === 1) {
    isSelected = false
  }
  // 通过扇形内径/外径的值,换算出辅助参数 k(默认值 1/3)
  k = typeof k !== 'undefined' ? k : 1 / 3
  // 计算选中效果分别在 x 轴、y 轴方向上的位移(未选中,则位移均为 0)
  const offsetX = isSelected ? Math.cos(midRadian) * 0.1 : 0
  const offsetY = isSelected ? Math.sin(midRadian) * 0.1 : 0
  // 计算高亮效果的放大比例(未高亮,则比例为 1)
  const hoverRate = isHovered ? 1.05 : 1
  // 返回曲面参数方程
  return {
    u: {
      min: -Math.PI,
      max: Math.PI * 3,
      step: Math.PI / 32
    },
    v: {
      min: 0,
      max: Math.PI * 2,
      step: Math.PI / 20
    },
    x: function (u, v) {
      if (u < startRadian) {
        return (
          offsetX +
          Math.cos(startRadian) * (1 + Math.cos(v) * k) * hoverRate
        )
      }
      if (u > endRadian) {
        return (
          offsetX + Math.cos(endRadian) * (1 + Math.cos(v) * k) * hoverRate
        )
      }
      return offsetX + Math.cos(u) * (1 + Math.cos(v) * k) * hoverRate
    },
    y: function (u, v) {
      if (u < startRadian) {
        return (
          offsetY +
          Math.sin(startRadian) * (1 + Math.cos(v) * k) * hoverRate
        )
      }
      if (u > endRadian) {
        return (
          offsetY + Math.sin(endRadian) * (1 + Math.cos(v) * k) * hoverRate
        )
      }
      return offsetY + Math.sin(u) * (1 + Math.cos(v) * k) * hoverRate
    },
    z: function (u, v) {
      if (u < -Math.PI * 0.5) {
        return Math.sin(u)
      }
      if (u > Math.PI * 2.5) {
        return Math.sin(u) * h * 0.1
      }
      return Math.sin(v) > 0 ? 1 * h * 0.1 : -1
    }
  }
}

/**
 * 获取3d丙图的最高扇区的高度
 */
const getHeight3D = (series, height) => {
  series.sort((a, b) => {
    return b.pieData.value - a.pieData.value
  })
  return (height * 25) / series[0].pieData.value
}

/**
 * 格式化浮点数
 */
const fomatFloat = (num, n) => {
  let f = parseFloat(num)
  if (isNaN(f)) {
    return false
  }
  f = Math.round(num * Math.pow(10, n)) / Math.pow(10, n) // n 幂
  let s = f.toString()
  let rs = s.indexOf('.')
  // 判定如果是整数,增加小数点再补0
  if (rs < 0) {
    rs = s.length
    s += '.'
  }
  while (s.length <= rs + n) {
    s += '0'
  }
  return s
}

export {
  getPie3D,
  getParametricEquation
}
vue图表组件
<script lang="ts" setup>
import { onMounted, onUnmounted, watch, nextTick, ref } from "vue";
import * as echarts from "echarts";
import "echarts-gl";
import WCion from "@/assets/images/wcion.png";
import { getPie3D, getParametricEquation } from "../../../utils/pieChart";

import type { DeviceInfoQueryVO } from "@/api/types";
import { ElNotification, type FormInstance } from "element-plus";
import emitter from "@/utils/bus";
// 响应式数据
const statusChart = ref<echarts.ECharts | null>(null);
const option = ref<any>({ series: [] });
const optionData = ref([]);
const selectedIndex = ref<number | null>(null);
const hoveredIndex = ref<number | null>(null);
const queryParams = ref<DeviceInfoQueryVO>({

});
onMounted(() => {
  getEquipmentType();
  window.addEventListener("resize", handleResize);
});
// 接口数据
const getEquipmentType = async () => {
  try {
    const res = await 后台接口(queryParams.value);
    optionData.value = res;
    nextTick(() => {
      initChart(optionData.value);
    });
  } catch (error) {
    ElNotification({
      title: "获取失败",
      // message: error,
      type: "error",
      duration: 300,
    });
  }
};

// 图表初始化
const initChart = (data: any) => {
  console.log("@#data", data);
  statusChart.value = echarts.init(document.getElementById("pieChartMap"));

  const colors = ["#00d7e9", "#84f1c4", "#24b6fe"];

  const twoDData = data.map((item: any, index: number) => ({
    ...item,
    itemStyle: {
      color: colors[index % colors.length],
    },
  }));
  console.log("twoDData", twoDData);

  // 传入数据生成 option, 构建3d饼状图, 参数工具文件已经备注的很详细
  option.value = getPie3D(data, 0, 240, 28, 15, 1, colors);
  statusChart.value.setOption(option.value);
  // 是否需要label指引线,如果要就添加一个透明的2d饼状图并调整角度使得labelLine和3d的饼状图对齐,并再次setOption
  option.value.series.push({
    name: "pie2d",
    backgroundColor: "transparent",
    type: "pie",
    label: {
      opacity: 1,
      fontSize: 13,
      lineHeight: 20,
      color: "#fff",
    },
    startAngle: -40, // 起始角度,支持范围[0, 360]。
    clockwise: false, // 饼图的扇区是否是顺时针排布。上述这两项配置主要是为了对齐3d的样式
    radius: ["40%", "50%"],
    center: ["50%", "50%"],
    data: twoDData,
    itemStyle: {
      opacity: 0, // 这里必须是0,不然2d的图会覆盖在表面
    },
  });
  statusChart.value.setOption(option.value);
  bindListen(statusChart.value);
};

const bindListen = (myChart: any, optionName = "option") => {
  let selectedIndex = "";
  let hoveredIndex = "";
  // 监听点击事件,实现选中效果(单选)
  myChart.on("click", (params: any) => {
    emitter.emit("visibilityDeviceState", {
      visibilityState: true,
      deviceTypeCode: params.data.code,
    });
    // alert("@");
    // 从 option.series 中读取重新渲染扇形所需的参数,将是否选中取反。
    const isSelected =
      option.value.series[params.seriesIndex].pieStatus.selected;
    const isHovered = option.value.series[params.seriesIndex].pieStatus.hovered;
    const k = option.value.series[params.seriesIndex].pieStatus.k;
    const startRatio =
      option.value.series[params.seriesIndex].pieData.startRatio;
    const endRatio = option.value.series[params.seriesIndex].pieData.endRatio;
    // 如果之前选中过其他扇形,将其取消选中(对 option 更新)
    if (selectedIndex !== "" && selectedIndex !== params.seriesIndex) {
      option.value.series[selectedIndex].parametricEquation =
        getParametricEquation(
          option.value.series[selectedIndex].pieData.startRatio,
          option.value.series[selectedIndex].pieData.endRatio,
          false,
          false,
          k,
          option.value.series[selectedIndex].pieData.value
        );
      option.value.series[selectedIndex].pieStatus.selected = false;
    }
    // 对当前点击的扇形,执行选中/取消选中操作(对 option 更新)
    option.value.series[params.seriesIndex].parametricEquation =
      getParametricEquation(
        startRatio,
        endRatio,
        isSelected,
        isHovered,
        k,
        option.value.series[params.seriesIndex].pieData.value
      );
    option.value.series[params.seriesIndex].pieStatus.selected = isSelected;
    // 如果本次是选中操作,记录上次选中的扇形对应的系列号 seriesIndex
    selectedIndex = isSelected ? params.seriesIndex : null;
    // 使用更新后的 option,渲染图表
    myChart.setOption(option.value);
  });
  // 监听 mouseover,近似实现高亮(放大)效果
  myChart.on("mouseover", (params: any) => {
    // 准备重新渲染扇形所需的参数
    let isSelected;
    let isHovered;
    let startRatio;
    let endRatio;
    let k;
    // 如果触发 mouseover 的扇形当前已高亮,则不做操作
    if (hoveredIndex === params.seriesIndex) {
      // 否则进行高亮及必要的取消高亮操作
    } else {
      // 如果当前有高亮的扇形,取消其高亮状态(对 option 更新)
      if (hoveredIndex !== "") {
        // 从 option.series 中读取重新渲染扇形所需的参数,将是否高亮设置为 false。
        isSelected = option.value.series[hoveredIndex].pieStatus.selected;
        isHovered = false;
        startRatio = option.value.series[hoveredIndex].pieData.startRatio;
        endRatio = option.value.series[hoveredIndex].pieData.endRatio;
        k = option.value.series[hoveredIndex].pieStatus.k;
        // 对当前点击的扇形,执行取消高亮操作(对 option 更新)
        option.value.series[hoveredIndex].parametricEquation =
          getParametricEquation(
            startRatio,
            endRatio,
            isSelected,
            isHovered,
            k,
            option.value.series[hoveredIndex].pieData.value
          );
        option.value.series[hoveredIndex].pieStatus.hovered = isHovered;
        // 将此前记录的上次选中的扇形对应的系列号 seriesIndex 清空
        hoveredIndex = "";
      }
      // 如果触发 mouseover 的扇形不是透明圆环,将其高亮(对 option 更新)
      if (
        params.seriesName !== "mouseoutSeries" &&
        params.seriesName !== "pie2d"
      ) {
        // 从 option.series 中读取重新渲染扇形所需的参数,将是否高亮设置为 true。
        isSelected = option.value.series[params.seriesIndex].pieStatus.selected;
        isHovered = true;
        startRatio = option.value.series[params.seriesIndex].pieData.startRatio;
        endRatio = option.value.series[params.seriesIndex].pieData.endRatio;
        k = option.value.series[params.seriesIndex].pieStatus.k;
        // 对当前点击的扇形,执行高亮操作(对 option 更新)
        option.value.series[params.seriesIndex].parametricEquation =
          getParametricEquation(
            startRatio,
            endRatio,
            isSelected,
            isHovered,
            k,
            option.value.series[params.seriesIndex].pieData.value + 60
          );
        option.value.series[params.seriesIndex].pieStatus.hovered = isHovered;
        // 记录上次高亮的扇形对应的系列号 seriesIndex
        hoveredIndex = params.seriesIndex;
      }
      // 使用更新后的 option,渲染图表
      myChart.setOption(option.value);
    }
  });
  // 修正取消高亮失败的 bug
  myChart.on("globalout", (params: any) => {
    // 准备重新渲染扇形所需的参数
    let isSelected;
    let isHovered;
    let startRatio;
    let endRatio;
    let k;
    if (hoveredIndex !== "") {
      // 从 option.series 中读取重新渲染扇形所需的参数,将是否高亮设置为 true。
      isSelected = option.value.series[hoveredIndex].pieStatus.selected;
      isHovered = false;
      k = option.value.series[hoveredIndex].pieStatus.k;
      startRatio = option.value.series[hoveredIndex].pieData.startRatio;
      endRatio = option.value.series[hoveredIndex].pieData.endRatio;
      // 对当前点击的扇形,执行取消高亮操作(对 option 更新)
      option.value.series[hoveredIndex].parametricEquation =
        getParametricEquation(
          startRatio,
          endRatio,
          isSelected,
          isHovered,
          k,
          option.value.series[hoveredIndex].pieData.value
        );
      option.value.series[hoveredIndex].pieStatus.hovered = isHovered;
      // 将此前记录的上次选中的扇形对应的系列号 seriesIndex 清空
      hoveredIndex = "";
    }
    // 使用更新后的 option,渲染图表
    myChart.setOption(option.value);
  });
};

// 窗口大小调整
const handleResize = () => {
  statusChart.value?.resize();
};

// 图表初始化
</script>
2.柱状图实现
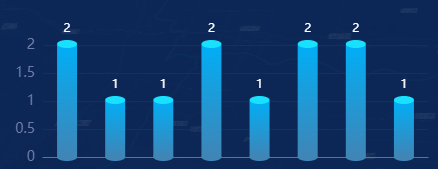
Barchart.js文件
import * as echarts from 'echarts'

/*3D柱形图*/
const get3DOptions = (op = {}) => {
  var options = {
    grid: {
      left: 60,
      right: 20,
      top: 50,
      bottom: 40
    },
    legend: {
      show: true,
      icon: 'circle',
      orient: 'horizontal',
      top: '90.5%',
      right: 'center',
      itemWidth: 16.5,
      itemHeight: 6,
      textStyle: {
        color: '#C9C8CD',
        fontSize: 14
      }
    },
    xAxis: [{
      data: op.xData || [],
      axisLabel: {
        show: true,
        interval: 0,
        textStyle: {
          color: '#6f7ca6',
          fontSize: 12
        },
        margin: 15, //刻度标签与轴线之间的距离。
      },
      axisLine: {
        show: true //不显示x轴
      },
      axisTick: {
        show: false //不显示刻度
      },
      boundaryGap: true,
      splitLine: {
        show: false,
        width: 1,
        lineStyle: {
          type: "solid",
          color: "#03202E"
        }
      }
    }],
    yAxis: [{
      show: true,
      axisLabel: {
        interval: 'auto',
        show: true,
        textStyle: {
          fontSize: 14,
          color: '#6f7ca6',
        },
      },
      splitLine: {
        show: true,
        lineStyle: {
          color: 'rgba(28,45,86,1)',
        },
      },
      axisTick: {
        show: false,
      },
      axisLine: {
        show: false,
        lineStyle: {
          color: 'rgba(49,176,255,0.5)',
        },
      },
    }],
    series: [
      {//柱底圆片
        name: "",
        type: "pictorialBar",
        symbolSize: [20, 8],//调整截面形状
        symbolOffset: [0, 4],
        z: 12,
        itemStyle: {
          opacity: 0.6, // 所有柱子透明度 0.6
          normal: {
            color: '#3f85b6',
          }
        },
        data: op.data || []
      },
      //柱体
      {
        name: '',
        type: 'bar',
        barWidth: 20,
        barGap: '0%',
        itemStyle: {
          opacity: 0.2, // 所有柱子透明度 0.2
          color: () => {
            return new echarts.graphic.LinearGradient(0, 0, 0, 1, [
              { offset: 0, color: '#01AEF6'},
              { offset: 1, color: 'rgba(63,133,182,1)' },
            ])
          },
          opacity:1
        },
        data: op.data || []
      },
      //柱顶圆片
      {
        name: "",
        type: "pictorialBar",
        symbolSize: [20, 8],//调整截面形状
        symbolOffset: [0, -5],
        z: 12,
        symbolPosition: "end",
        label: {
          show: true,
          position: 'top',
          textStyle: {
            color: '#fff'
          }
        },
        itemStyle: {
          normal: {
            color: '#17E1FF',
          }
        },
        data: op.data || []
      }
    ]
  }
  return options;
};

export { get3DOptions }
图表组件
<template>
  <div>
    <div class="left-panel">
      <h3 style="margin-top: 15px"><img :src="WCion" />道路附属设施类型</h3>
      <div id="3DBarCharts" class="chart" />
    </div>
  </div>
</template>
<script lang="ts" setup>
import { onMounted, onUnmounted, watch, nextTick, ref } from "vue";
import * as echarts from "echarts";
import "echarts-gl";
import WCion from "../../../assets/images/wciont.png";
import { get3DOptions } from "../../../utils/Barchart";
import { ElNotification, type FormInstance } from "element-plus";
import { ScreenApi } from "@/api/screen";
import type { RoadFacilityQueryVO } from "@/api/types";
import emitter from "@/utils/bus";

const queryParams = ref<RoadFacilityQueryVO>({

})

onMounted(() => {
  getAncillary();
});

const getAncillary = async () => {
  try {
    const res = await 后台接口(queryParams.value);
    let facilityXData = res.nameData || [];
    let facilityYData = res.valueData || [];
    initChart(facilityXData, facilityYData);
  } catch (error) {
    ElNotification({
      title: "获取失败",
      message: error,
      type: "error",
      duration: 300,
    });
  }
};

// 图表初始化
const initChart = (XData: any, YData: any) => {
  nextTick(() => {
    const option = {
      xData: XData,
      data: YData,
    };

    let output_3DBarCharts = echarts.init(
      document.getElementById("3DBarCharts")
    );
    var options = get3DOptions(option);
    output_3DBarCharts.setOption(options);

    window.addEventListener("resize", function () {
      output_3DBarCharts.resize();
    });

    output_3DBarCharts.on("click", (params: any) => {
      emitter.emit('visibilityFacilityType',{visibilityState: true, facilityType: params.name, roadId: queryParams.value.roadId, sectionId: queryParams.value.sectionId})
    })
  });
};

emitter.on('roadChange',(data: any) => {
  queryParams.value.roadId = data.roadId ? data.roadId : undefined
  getAncillary()
})

emitter.on('roadSectionChange',(data: any) => {
  queryParams.value.sectionId = data.sectionId ? data.sectionId : undefined
  getAncillary()
})
</script>

Agent 垂直技术社区,欢迎活跃、内容共建。
更多推荐



 4
4 0
0- 0


 已为社区贡献4条内容

所有评论(0)