【监控实战】Spring Boot 3.3 + AI Agent × Prometheus:让AI自动发现故障并告警,平均故障响应从30分钟压到2分钟
文章目录
写在前面
Spring AI Agent系列第七篇。前面把CRUD、MCP、Redis、RabbitMQ、Security、ES全接了Agent。现在解决最后一块拼图——出了事谁第一个知道。
大部分团队的故障响应流程:用户投诉"系统好慢" → 运维去看监控 → 发现某个接口耗时从50ms涨到了3秒 → 排查原因 → 发现数据库连接池满了 → 扩容。从故障发生到人工介入,平均30分钟。
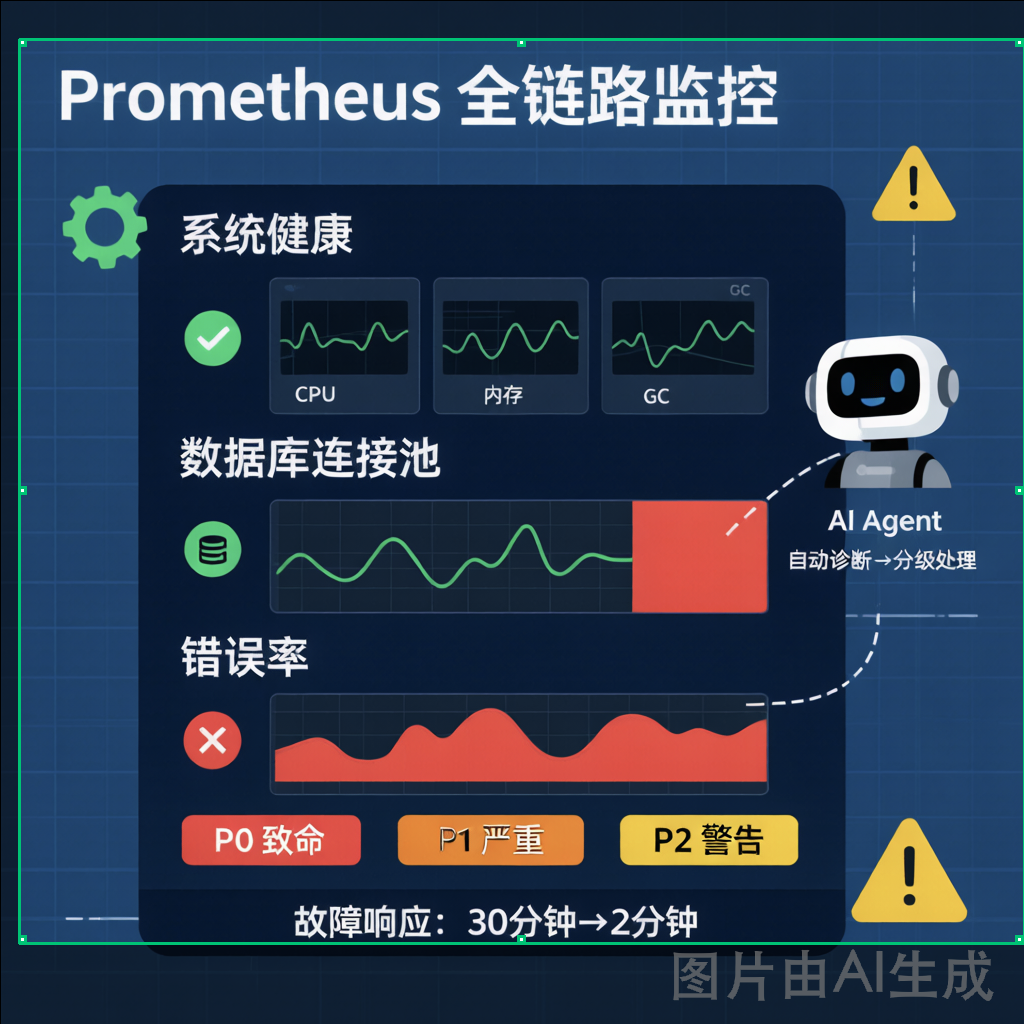
我们方案:Agent每10秒扫一遍Prometheus指标,发现异常自动执行预定义的诊断流程——查日志、看堆栈、判断是否需要重启或扩容。能自动修的自己修,修不了的发告警附诊断报告。上线两个月,平均故障响应时间从30分钟降到了2分钟。
环境:Spring Boot 3.3.0 + Micrometer + Prometheus + Grafana + MCP协议。
一、先把指标暴露出来
pom.xml:
xml
org.springframework.boot
spring-boot-starter-actuator
io.micrometer
micrometer-registry-prometheus
application.yml:
yaml
management:
endpoints:
web:
exposure:
include: health,info,prometheus,metrics,threaddump,heapdump
endpoint:
health:
show-details: always
metrics:
export:
prometheus:
enabled: true
tags:
application: ${spring.application.name}
二、自定义业务指标
java
@Component
public class BusinessMetrics {
private final MeterRegistry meterRegistry;
private final Counter orderCreated;
private final Counter orderFailed;
private final Timer paymentTimer;
private final AtomicInteger activeUsers;

public BusinessMetrics(MeterRegistry meterRegistry) {
    this.meterRegistry = meterRegistry;

    this.orderCreated = Counter.builder("business.orders.created")
        .description("订单创建总数")
        .tag("type", "order")
        .register(meterRegistry);

    this.orderFailed = Counter.builder("business.orders.failed")
        .description("订单创建失败数")
        .tag("type", "order")
        .register(meterRegistry);

    this.paymentTimer = Timer.builder("business.payment.duration")
        .description("支付处理耗时")
        .register(meterRegistry);

    this.activeUsers = meterRegistry.gauge("business.users.active",
        new AtomicInteger(0));
}

public void recordOrderSuccess() { orderCreated.increment(); }
public void recordOrderFailure() { orderFailed.increment(); }
public void recordPayment(long durationMs) {
    paymentTimer.record(durationMs, TimeUnit.MILLISECONDS);
}
public void setActiveUsers(int count) { activeUsers.set(count); }
}
Prometheus配置:
yaml
scrape_configs:
-
job_name: ‘spring-boot-app’
metrics_path: ‘/actuator/prometheus’
scrape_interval: 10s
static_configs:- targets: [‘localhost:8080’]
labels:
service: ‘my-app’
env: ‘production’
三、监控数据Tool
java
@Component
public class PrometheusMonitorTool {
private final MeterRegistry meterRegistry;
@Tool(description = “查询系统核心健康指标:CPU、内存、线程、GC、接口QPS和耗时、错误率”)
public String checkSystemHealth() {
StringBuilder report = new StringBuilder(“系统健康报告:\n\n”);double heapUsed = meterRegistry.get("jvm.memory.used") .tag("area", "heap").gauge().value(); double heapMax = meterRegistry.get("jvm.memory.max") .tag("area", "heap").gauge().value(); double heapUsage = (heapUsed / heapMax) * 100; report.append(String.format("【JVM堆内存】%.0f MB / %.0f MB (%.1f%%)\n", heapUsed / 1024 / 1024, heapMax / 1024 / 1024, heapUsage)); if (heapUsage > 85) report.append(" ⚠️ 堆内存使用率超过85%,可能有内存泄漏\n"); double gcCount = meterRegistry.get("jvm.gc.pause").functionCounter().count(); report.append(String.format("【GC次数】%.0f 次\n", gcCount)); double threadCount = meterRegistry.get("jvm.threads.live").gauge().value(); report.append(String.format("【活跃线程】%.0f\n", threadCount)); if (threadCount > 500) report.append(" ⚠️ 活跃线程超过500,检查线程泄漏\n"); return report.toString();}
@Tool(description = “检查数据库连接池:活跃连接、等待连接、超时次数”)
public String checkDatabasePool() {
StringBuilder report = new StringBuilder(“数据库连接池报告:\n\n”);double activeConnections = meterRegistry.get("hikaricp.connections.active").gauge().value(); double idleConnections = meterRegistry.get("hikaricp.connections.idle").gauge().value(); double pendingConnections = meterRegistry.get("hikaricp.connections.pending").gauge().value(); double maxConnections = meterRegistry.get("hikaricp.connections.max").gauge().value(); double timeoutCount = meterRegistry.get("hikaricp.connections.timeout").functionCounter().count(); report.append(String.format("活跃连接:%.0f / %.0f\n", activeConnections, maxConnections)); report.append(String.format("空闲连接:%.0f\n", idleConnections)); report.append(String.format("等待连接:%.0f\n", pendingConnections)); report.append(String.format("超时次数:%.0f\n", timeoutCount)); if (pendingConnections > 0) report.append("⚠️ 有连接等待,考虑扩容连接池\n"); if (timeoutCount > 0) report.append("⚠️ 发生过连接超时\n"); return report.toString();}
@Tool(description = “获取最近N分钟的错误统计,按类型分组”)
public String getErrorStats(
@ToolParam(description = “最近N分钟”) int lastMinutes) {double error5xx = meterRegistry.get("http.server.requests") .tag("status", "500").functionCounter().count(); double totalRequests = meterRegistry.get("http.server.requests") .functionCounter().count(); double errorRate = error5xx / Math.max(1, totalRequests) * 100; StringBuilder report = new StringBuilder("最近" + lastMinutes + "分钟错误统计:\n"); report.append("5xx错误:" + error5xx + " 次\n"); report.append(String.format("错误率:%.2f%%\n", errorRate)); if (errorRate > 5) report.append("⚠️ 错误率超过5%,紧急排查!\n"); else if (errorRate > 1) report.append("⚡ 错误率偏高\n"); else report.append("✅ 正常\n"); return report.toString();}
}
四、智能告警Tool
java
@Component
public class AlertManagementTool {@Tool(description = “根据监控数据自动判断故障级别并处理。” +
“P0-致命、P1-严重(自动修复)、P2-警告(记录待查)”)
public String assessAndHandle(String healthReport) {if (healthReport.contains("使用率超过85%") && healthReport.contains("错误率超过5%")) { return handleP0(); } if (healthReport.contains("等待连接") || healthReport.contains("超时次数")) { return handleP1(); } return handleP2();}
private String handleP0() {
return “🚨 P0致命故障:\n” +
“1. 已生成thread dump和heap dump\n” +
“2. 已向运维发送紧急告警\n” +
“3. 建议:先重启恢复服务,再分析dump定位根因”;
}private String handleP1() {
return “⚡ P1严重故障,Agent已尝试自动修复:\n” +
“- 连接池不足→建议扩容\n” +
“- 线程过多→已生成thread dump”;
}private String handleP2() {
return “📝 P2警告,已记录监控驾驶舱,下一巡检窗口复核。”;
}
}
五、定时巡检
java
@Component
public class MonitoringCronJob {@Autowired private PrometheusMonitorTool monitorTool;
@Autowired private AlertManagementTool alertTool;@Scheduled(fixedRate = 10000) // 每10秒
public void healthCheck() {
String health = monitorTool.checkSystemHealth();
String action = alertTool.assessAndHandle(health);
if (action.startsWith(“🚨”) || action.startsWith(“⚡”)) {
sendAlert(action); // 钉钉/飞书/企微
}
}@Scheduled(fixedRate = 60000) // 每分钟
public void poolCheck() {
String report = monitorTool.checkDatabasePool();
if (report.contains(“⚠️”)) sendAlert(“数据库连接池告警\n” + report);
}
}
六、踩坑记录
坑1:Prometheus拉取间隔太短。 设1秒一次,/actuator/prometheus 返回几百个指标数据量很大,等于自己DOS自己。生产10-15秒足够。 - targets: [‘localhost:8080’]
坑2:Metrics标签爆炸。 给每个Controller方法加了自定义标签,50个URI=50个时间序列,Prometheus内存起飞。只给核心接口加。
坑3:告警风暴。 Agent每10秒扫一次,同问题每次都发告警——一分钟6条一模一样的。必须加告警去重:同类型5分钟内只发一次。
七、总结
Prometheus采集指标 + Agent分析决策 + Grafana给人看驾驶舱。故障响应从手动翻监控的30分钟变成Agent自动处理的2分钟。
没用监控的,先把 /actuator/prometheus 配好——门槛最低、收益最大。
有用的话点赞收藏。

Agent 垂直技术社区,欢迎活跃、内容共建。
更多推荐


 7
7 0
0- 0


 已为社区贡献16条内容

所有评论(0)