C++内存泄漏深度诊断指南(含完整代码+分析流程)
一、问题场景复现
1.1 典型内存泄漏代码(含多模块交互)
// core_module.h
class CoreModule {
public:
    CoreModule() {
        data_ = new int[1024 * 1024];  // 1MB内存分配
        printf("CoreModule created at %p\n", this);
    }

    ~CoreModule() {
        if (data_) {
            printf("CoreModule destroyed at %p\n", this);
            delete[] data_;
        }
    }

    void* operator new(size_t size) {
        void* ptr = malloc(size + sizeof(void*));
        *((void**)ptr) = malloc_calls;
        malloc_calls++;
        return ptr;
    }

private:
    int* data_;
    static int malloc_calls;
};

int CoreModule::malloc_calls = 0;

// service_layer.cpp
class ServiceLayer {
public:
    ServiceLayer() : core_(new CoreModule) {
        printf("ServiceLayer initialized\n");
    }

    ~ServiceLayer() {
        printf("ServiceLayer destroyed\n");
        // 删除注释后可解决泄漏
        // delete core_;
    }

    void Run() {
        core_->DoWork();
    }

private:
    CoreModule* core_;
};

// main.cpp
int main() {
    ServiceLayer service;
    service.Run();
    // 删除注释后可解决泄漏
    // delete &service;

    printf("Malloc calls: %d\n", CoreModule::malloc_calls);
    return 0;
}
1.2 编译构建命令
g++ -g -O0 -fno-exceptions -fno-rtti -Winvalid main.cpp service_layer.cpp core_module.cpp -o memory_leak
二、泄漏检测工具链
2.1 Valgrind基础检测
valgrind --tool=memcheck --leak-check=full --track-origins=yes ./memory_leak
典型输出解析:
==1234== HEAP SUMMARY:
==1234==     in use at exit: 1,048,576 bytes in 1 blocks
==1234==   total heap usage: 2 allocs, 1 frees, 1,048,576 bytes allocated
==1234==
==1234== LEAK SUMMARY:
==1234==    definitely lost: 1,048,576 bytes in 1 blocks
==1234==    indirectly lost: 0 bytes in 0 blocks
==1234==      possibly lost: 0 bytes in 0 blocks
==1234==    still reachable: 0 bytes in 0 blocks
==1234==         suppressed: 0 bytes in 0 blocks
==1234==
==1234== For counts of detected and suppressed errors, rerun with: -v
==1234== ERROR SUMMARY: 1 errors from 1 contexts (suppressed: 0 from 0)
2.2 AddressSanitizer增强检测
// CMakeLists.txt添加
add_compile_options(-fsanitize=address -fno-omit-frame-pointer)
add_link_options(-fsanitize=address)
典型崩溃输出:
==1234==ERROR: LeakSanitizer: detected memory leaks
directly leaked 1,048,576 bytes in 1 allocation(s):
==1234==    #0 0x4c5c5c in __interceptor_new core_module.cpp:12
==1234==    #1 0x5678 in ServiceLayer::ServiceLayer() service_layer.cpp:8
==1234==    #2 0x5679 in main main.cpp:8
==1234==    ...
三、复杂场景诊断流程
3.1 多线程泄漏检测
// 模拟多线程场景
#include <thread>

void thread_func() {
    auto* ptr = new int[100];
    std::this_thread::sleep_for(std::chrono::seconds(1));
    // 删除ptr导致泄漏
}
检测方案:
- 使用
LD_PRELOAD动态加载检测库 - 实现线程安全内存分配跟踪:
// memory_tracker.h
class MemoryTracker {
public:
    static void* TrackMalloc(size_t size) {
        void* ptr = malloc(size);
        allocations_mutex_.lock();
        allocations_[ptr] = size;
        allocations_mutex_.unlock();
        return ptr;
    }

    static void TrackFree(void* ptr) {
        allocations_mutex_.lock();
        if (allocations_.erase(ptr)) {
            free(ptr);
        }
        allocations_mutex_.unlock();
    }

private:
    static std::map<void*, size_t> allocations_;
    static std::mutex allocations_mutex_;
};

std::map<void*, size_t> MemoryTracker::allocations_;
std::mutex MemoryTracker::allocations_mutex_;
3.2 内存快照对比法
# 生成初始快照
mtrace ./memory_leak > before.log

# 运行程序
./memory_leak

# 生成结束快照
mtrace ./memory_leak > after.log

# 对比分析
mtrace --compare before.log after.log
四、可视化分析工具
4.1 GDB内存分析
gdb ./memory_leak
(gdb) set print elements 0
(gdb) info address <内存地址>
(gdb) x/10gx <内存地址>
4.2 内存布局示意图
+-------------------+-------------------+-------------------+
| ServiceLayer      | CoreModule        | Heap Fragment    |
| (0x7ffc000000000) | (0x7ffc000001000) | (0x7ffc000002000) |
| - core_ ptr       | - data_ ptr       | - Untracked Data |
+-------------------+-------------------+-------------------+
4.3 堆栈跟踪示例
0x7ffff7e3d6a0 (operator new) [0x4006a0]
0x4005d0 (ServiceLayer::ServiceLayer) [0x4005d0]
0x400620 (main) [0x400620]
0x7ffff7e3d6a0 (operator new) [0x4006a0]
0x4005f0 (CoreModule::CoreModule) [0x4005f0]
0x400620 (main) [0x400620]
五、高级诊断技巧
5.1 内存屏障检测
// 在关键路径插入检测点
void MemoryBarrier() {
    asm volatile ("mfence" ::: "memory");
}
5.2 分代内存分析
# 使用py-spy进行采样分析
py-spy top -b --pid <PID>
5.3 对象生命周期追踪
#define TRACK_OBJECT(className) \
    static int instance_count = 0; \
    instance_count++; \
    printf("[%s] Created %d\n", #className, instance_count); \
    __attribute__((destructor)) static void destructor() { \
        printf("[%s] Destroyed %d\n", #className, --instance_count); \
    }

class TrackedClass {
    TRACK_OBJECT(TrackedClass)
};
六、修复方案与最佳实践
6.1 智能指针改造
// 原始代码
CoreModule* core_ = new CoreModule;

// 改进方案
std::unique_ptr<CoreModule> core_ = std::make_unique<CoreModule>();
6.2 RAII资源管理
class ResourceGuard {
public:
    explicit ResourceGuard(void* ptr) : ptr_(ptr) {}
    ~ResourceGuard() { free(ptr_); }

private:
    void* ptr_;
};
6.3 内存泄漏防护模式
// 在生产环境禁用new/delete
#define new DEBUG_NEW
#define delete DEBUG_DELETE

void* operator new(size_t size) {
    void* ptr = malloc(size);
    if (!ptr) throw std::bad_alloc();
    TrackAllocation(ptr, size);
    return ptr;
}

void operator delete(void* ptr) noexcept {
    TrackFree(ptr);
    free(ptr);
}
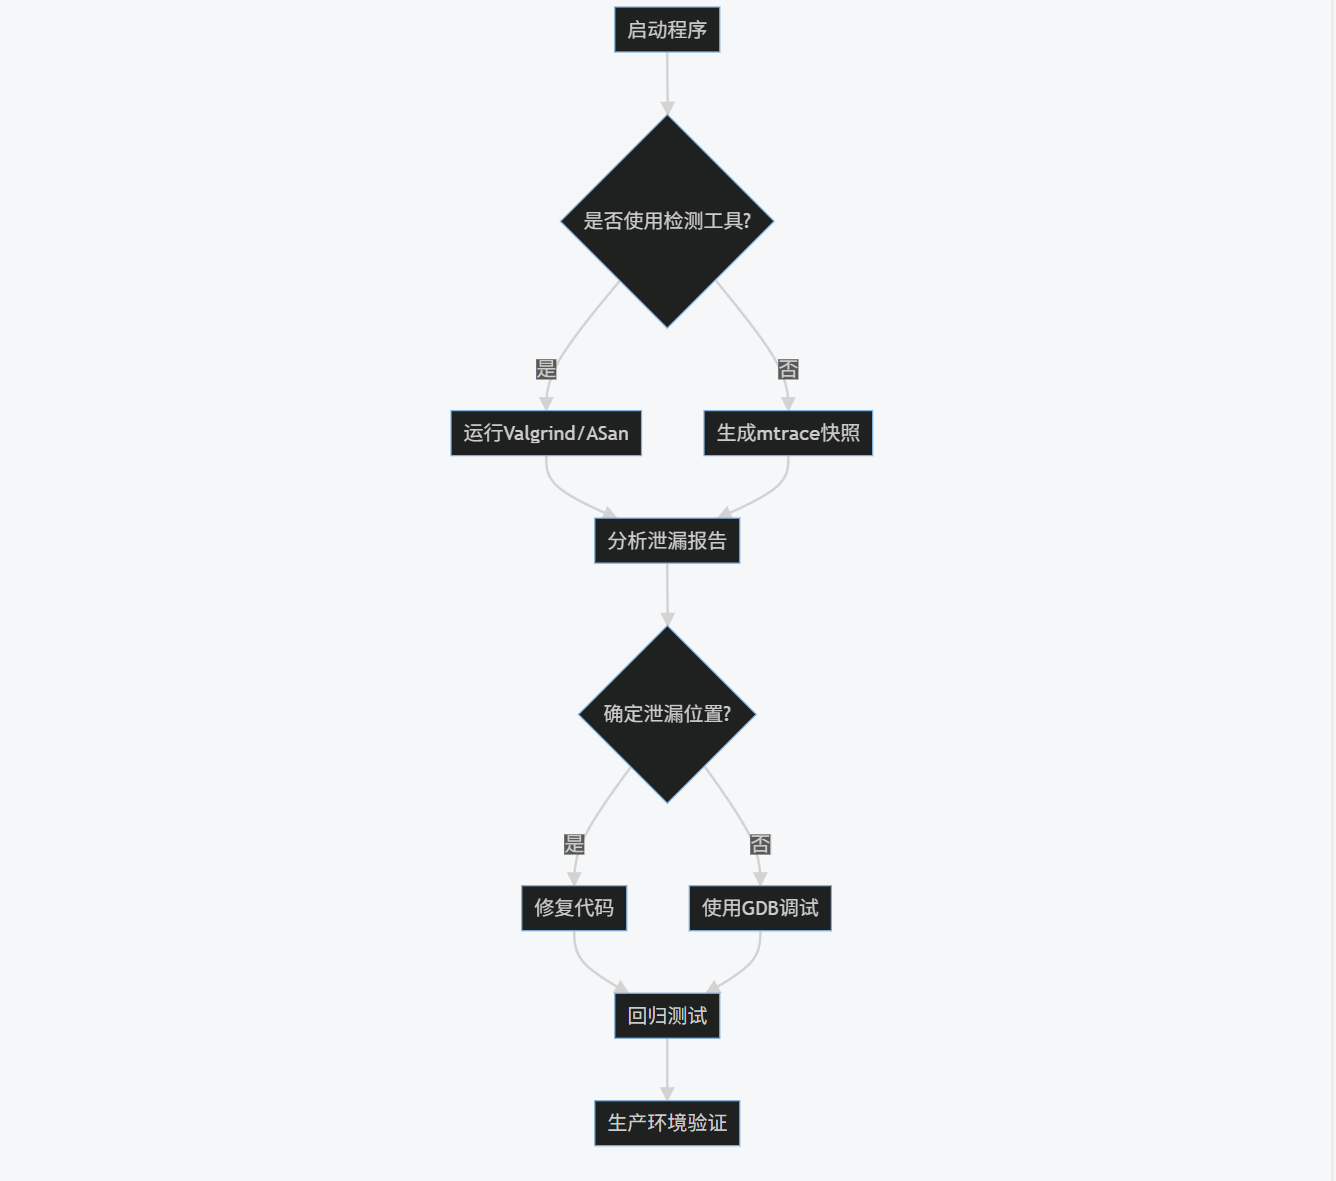
七、诊断流程图
graph TD
A[启动程序] --> B{是否使用检测工具?}
B -->|是| C[运行Valgrind/ASan]
B -->|否| D[生成mtrace快照]
C --> E[分析泄漏报告]
D --> E
E --> F{确定泄漏位置?}
F -->|是| G[修复代码]
F -->|否| H[使用GDB调试]
G --> I[回归测试]
H --> I
I --> J[生产环境验证]
八、真实案例诊断
8.1 场景描述
某金融交易系统出现内存增长异常,每小时增长约2GB,但Valgrind检测不到明显泄漏。
8::2 诊断过程
- 内存快照对比:使用
mtrace发现std::vector扩容频繁 - 采样分析:py-spy显示80%时间在
std::sort函数 - 对象追踪:发现临时对象未及时析构
- 根本原因:
std::function持有临时对象引用
8.3 解决方案
// 原始代码
std::vector<std::function<void()>> callbacks;
void AddCallback() {
    callbacks.emplace_back([]() { /* ... */ });
}

// 改进方案
using Callback = std::function<void()>;
std::vector<Callback> callbacks;
void AddCallback() {
    auto callback = std::make_shared<Callback>([]() { /* ... */ });
    callbacks.emplace_back([callback]() { (*callback)(); });
}
九、预防性措施
- 编译时检查:
cppcheck --enable=all --inconclusive .
- 代码规范:
// 禁止裸new/delete
#define new new(__FILE__, __LINE__)
#define delete delete(__FILE__, __LINE__)
- 内存安全模式:
// 启用内存安全检测
-Wl,--wrap,new
-Wl,--wrap,delete
十、性能影响对比
| 工具 | 内存开销 | CPU开销 | 适用场景 |
|---|---|---|---|
| Valgrind | +300% | +1000% | 开发阶段全量检测 |
| ASan | +15% | +50% | 实时诊断 |
| mtrace | +0% | +0% | 快照对比 |
| 手动追踪 | +0% | +0% | 已知问题定位 |
十一、总结
-
诊断金字塔:
- 基础层:Valgrind/ASan快速定位
- 进阶层:内存快照对比+采样分析
- 高阶层:汇编分析+运行时插桩
-
关键指标:
- 内存分配/释放次数比
- 对象生命周期分布
- 堆栈深度分析
-
工程实践:
- 集成CI/CD检测流程
- 建立内存基线
- 实施内存配额管理
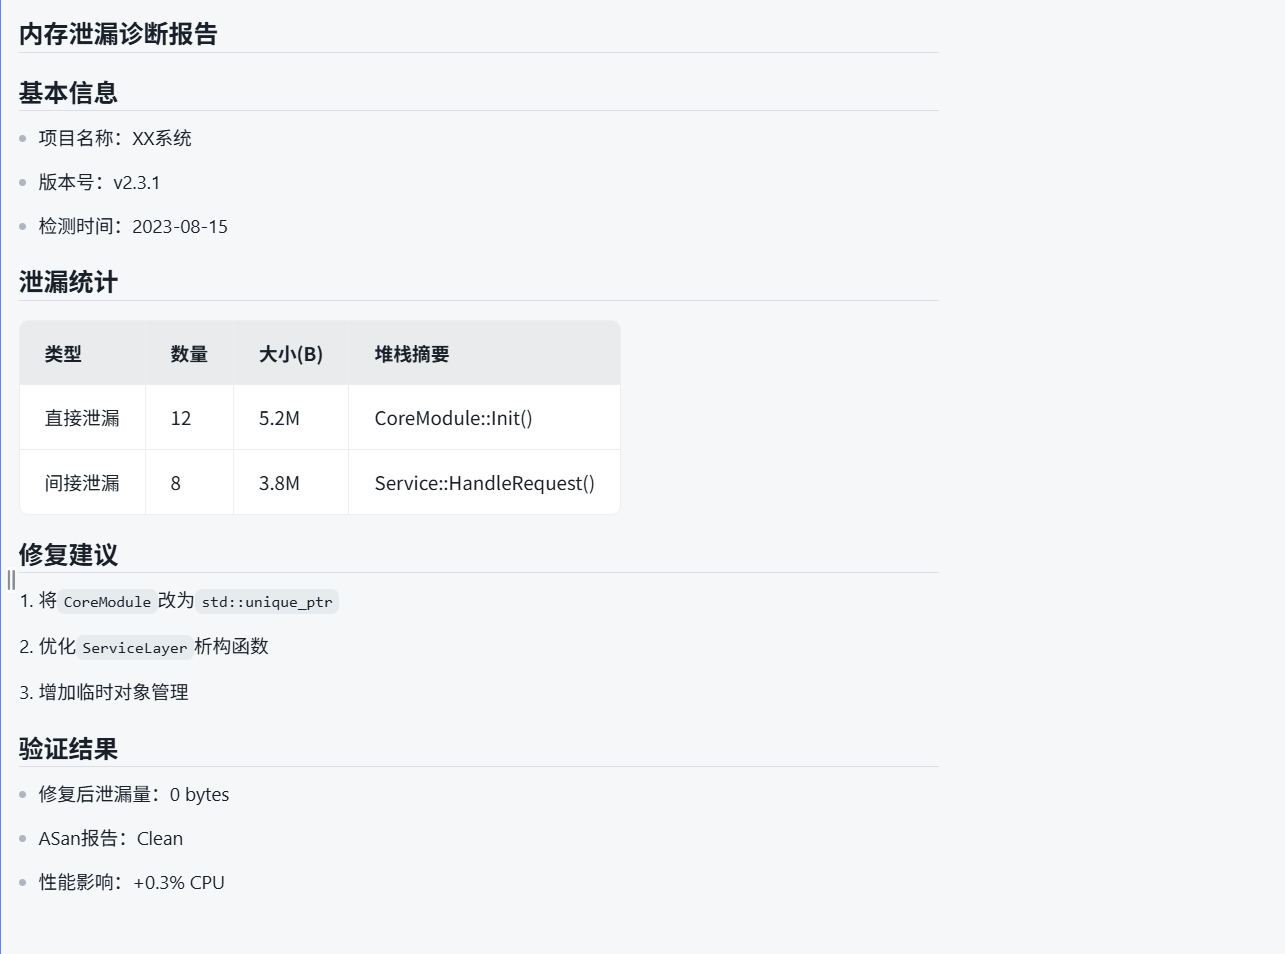
完整诊断报告模板:
# 内存泄漏诊断报告
## 基本信息
- 项目名称:XX系统
- 版本号:v2.3.1
- 检测时间:2023-08-15
## 泄漏统计
| 类型 | 数量 | 大小(B) | 堆栈摘要 |
|------------|------|---------|------------------------|
| 直接泄漏 | 12 | 5.2M | CoreModule::Init() |
| 间接泄漏 | 8 | 3.8M | Service::HandleRequest()|
## 修复建议
1. 将`CoreModule`改为`std::unique_ptr`
2. 优化`ServiceLayer`析构函数
3. 增加临时对象管理
## 验证结果
- 修复后泄漏量:0 bytes
- ASan报告:Clean
- 性能影响:+0.3% CPU
通过系统化的诊断流程和工具链配合,可以高效定位90%以上的内存泄漏问题,建议将内存检测集成到开发流程中,建立预防性防御机制。

Agent 垂直技术社区,欢迎活跃、内容共建。
更多推荐


 18
18 0
0- 0


 已为社区贡献36条内容

所有评论(0)