环形图,自定义legend和tooltip(Vue3)
·
效果图:
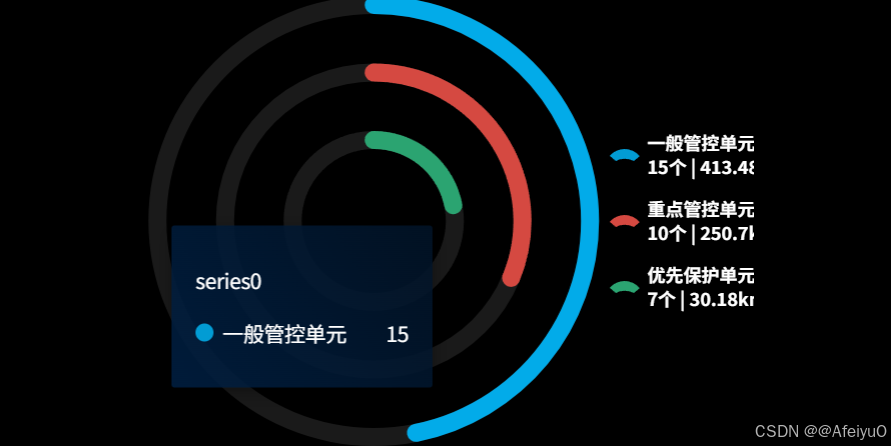
<template>
  <div class="go-MultiPie03">
    <div class="left-box">
      <v-chart
        ref="vChartRef"
        :option="options"
        style="width: 30%; height: 300px"
      >
      </v-chart>
    </div>
  </div>
</template>

<script setup lang="ts">
import { ref, computed } from "vue";
import VChart from "vue-echarts";
import { use } from "echarts/core";
import { CanvasRenderer } from "echarts/renderers";
import { GaugeChart, BarChart } from "echarts/charts";
import {
  TooltipComponent,
  LegendComponent,
  GridComponent,
} from "echarts/components";

use([
  CanvasRenderer,
  GaugeChart,
  BarChart,
  TooltipComponent,
  LegendComponent,
  GridComponent,
]);

// 定义颜色 - 确保在整个组件中统一使用这个颜色数组
const colors = [
  "rgba(2, 156, 212, 1)",
  "rgba(213, 73, 65, 1)",
  "rgba(43, 164, 113, 1)",
];

// 模拟接口数据数组
const chartData = ref([
  {
    name: "一般管控单元",
    value: "15",
    mj: "413.48",
  },
  {
    name: "重点管控单元",
    value: "10",
    mj: "250.7",
  },
  {
    name: "优先保护单元",
    value: "7",
    mj: "30.18",
  },
]);

// 获取图表实例
const vChartRef = ref();

// 计算总值
const getTotalValue = () => {
  return chartData.value
    .map((i) => Number(i.value))
    .reduce((pre, nex) => {
      return pre + nex;
    }, 0);
};

// 创建仪表盘系列
const createGaugeSeries = () => {
  const totalValue = getTotalValue();

  return chartData.value.map((item: any, index: number) => {
    return {
      type: "gauge",
      startAngle: 90,
      endAngle: -270,
      center: ["50%", "50%"],
      radius: `${100 - index * 30}%`,
      pointer: {
        show: false,
      },
      progress: {
        show: true,
        overlap: false,
        clip: false,
        roundCap: true,
        itemStyle: {
          color: colors[index], // 仪表盘颜色
        },
      },
      axisLine: {
        lineStyle: {
          color: [[1, "rgba(255, 255, 255, 0.1)"]],
          width: 12,
        },
      },
      axisTick: {
        show: false,
      },
      splitLine: {
        show: false,
      },
      axisLabel: {
        show: false,
      },
      title: {
        show: false,
      },
      detail: {
        show: false,
      },
      max: totalValue,
      data: [
        {
          value: parseFloat(item.value),
          name: item.name,
          itemStyle: {
            color: colors[index], // 数据项颜色,用于tooltip
          },
        },
      ],
    };
  });
};

// 创建图例数据
const createLegendData = () => {
  return chartData.value.map((item) => {
    return item.mj
      ? `${item.name}\n${item.value}个 | ${item.mj}km²`
      : `${item.name}\n${item.value}个`;
  });
};

// 创建柱状图系列(用于图例显示)
const createBarSeries = () => {
  const legendData = createLegendData();

  return chartData.value.map((item, index) => {
    return {
      name: legendData[index],
      type: "bar",
      barWidth: "0%", // 设置为0%使其不显示
      data: [0],
      itemStyle: {
        color: colors[index], // 图例颜色与仪表盘颜色对应
      },
      silent: true, // 禁用交互
    };
  });
};

// tooltip格式化函数
const tooltipPieHover = (params: any) => {
  let tooltipContent =
    '<div style="min-width:142px;padding:12px 16px;background-image: linear-gradient(239deg, #021326e6 0%, #001e40e6 100%);box-shadow: 0 5px 5px -3px #0000001a, 0 8px 10px 1px #0000000f, 0 3px 14px 2px #0000000d;border-radius: 2px;font-family:AlibabaPuHuiTi_2_85_Bold;letter-spacing: -0.25px;"><p style="color: #fff;margin-bottom: 8px;">' +
    (params.seriesName || "环形图") +
    "</p>";

  // 从数据项中获取颜色,确保与仪表盘颜色一致
  let color = params.color || colors[params.seriesIndex] || "#ffffff";

  // 使用圆形替代图标字体
  tooltipContent +=
    '<ul style="padding:0"><li style="display: flex;align-items: center;justify-content: space-between;color: #fff;font-size:14px;"><span style="display: flex;align-items: center;"><span style="display:inline-block;width:12px;height:12px;border-radius:50%;background-color: ' +
    color +
    ';margin-right: 6px;"></span>' +
    params.name +
    '</span><span style="margin-left:6px">' +
    params.value +
    "</span></li></ul>";

  return tooltipContent + "</div>";
};

// 主要配置选项
const options = computed(() => {
  const gaugeSeries = createGaugeSeries();
  const barlist = createBarSeries();
  const legendData = createLegendData();

  return {
    tooltip: {
      trigger: "item",
      formatter: (params: any) => {
        return tooltipPieHover(params);
      },
      backgroundColor: "transparent",
      borderWidth: 0,
      padding: 0,
      confine: true,
    },
    // 显示图例
    legend: {
      show: true,
      orient: "vertical",
      selectedMode: false,
      top: "middle",
      left: "80%",
      icon: "path://M505.408 320a638.72 638.72 0 0 1 496.896 236.608l-192.832 156.544A637.248 637.248 0 0 0 512 640c-106.752 0-207.36 26.112-295.872 72.32L19.2 543.808A638.592 638.592 0 0 1 505.408 320z",
      itemGap: 12,
      itemWidth: 20,
      itemHeight: 10,
      textStyle: {
        color: "#FFFFFF",
        fontWeight: 700,
        fontFamily: "AlibabaPuHuiTi_2_85_Bold",
        fontSize: 12,
        lineHeight: 16,
      },
      data: legendData,
    },
    grid: {
      show: false,
      left: "0%",
      right: "0%",
      top: "0%",
      bottom: "0%",
    },
    xAxis: {
      show: false,
      type: "category",
      data: [],
    },
    yAxis: {
      show: false,
      type: "value",
    },
    series: [...gaugeSeries, ...barlist],
  };
});
</script>

<style lang="scss" scoped>
.go-MultiPie03 {
  background-color: #000;
  width: 100%;
  height: 100%;
  display: flex;
  flex-direction: row;
  justify-content: flex-start;
  align-items: center;
  .left-box {
    width: 100%;
    height: 100%;
    position: relative;
  }
}
</style>

Agent 垂直技术社区,欢迎活跃、内容共建。
更多推荐


 1
1 0
0- 0


 已为社区贡献12条内容

所有评论(0)