基于大数据的健康风险预测数据可视化分析系统【python、Hadoop、spark、MySQL、python项目、大数据毕设选题、论文书写】【源码+论文+答辩】
💖💖作者:计算机编程小咖
💙💙个人简介:曾长期从事计算机专业培训教学,本人也热爱上课教学,语言擅长Java、微信小程序、Python、Golang、安卓Android等,开发项目包括大数据、深度学习、网站、小程序、安卓、算法。平常会做一些项目定制化开发、代码讲解、答辩教学、文档编写、也懂一些降重方面的技巧。平常喜欢分享一些自己开发中遇到的问题的解决办法,也喜欢交流技术,大家有技术代码这一块的问题可以问我!
💛💛想说的话:感谢大家的关注与支持!
💜💜
网站实战项目
安卓/小程序实战项目
大数据实战项目
深度学习实战项目
目录
基于大数据的健康风险预测数据可视化分析系统介绍
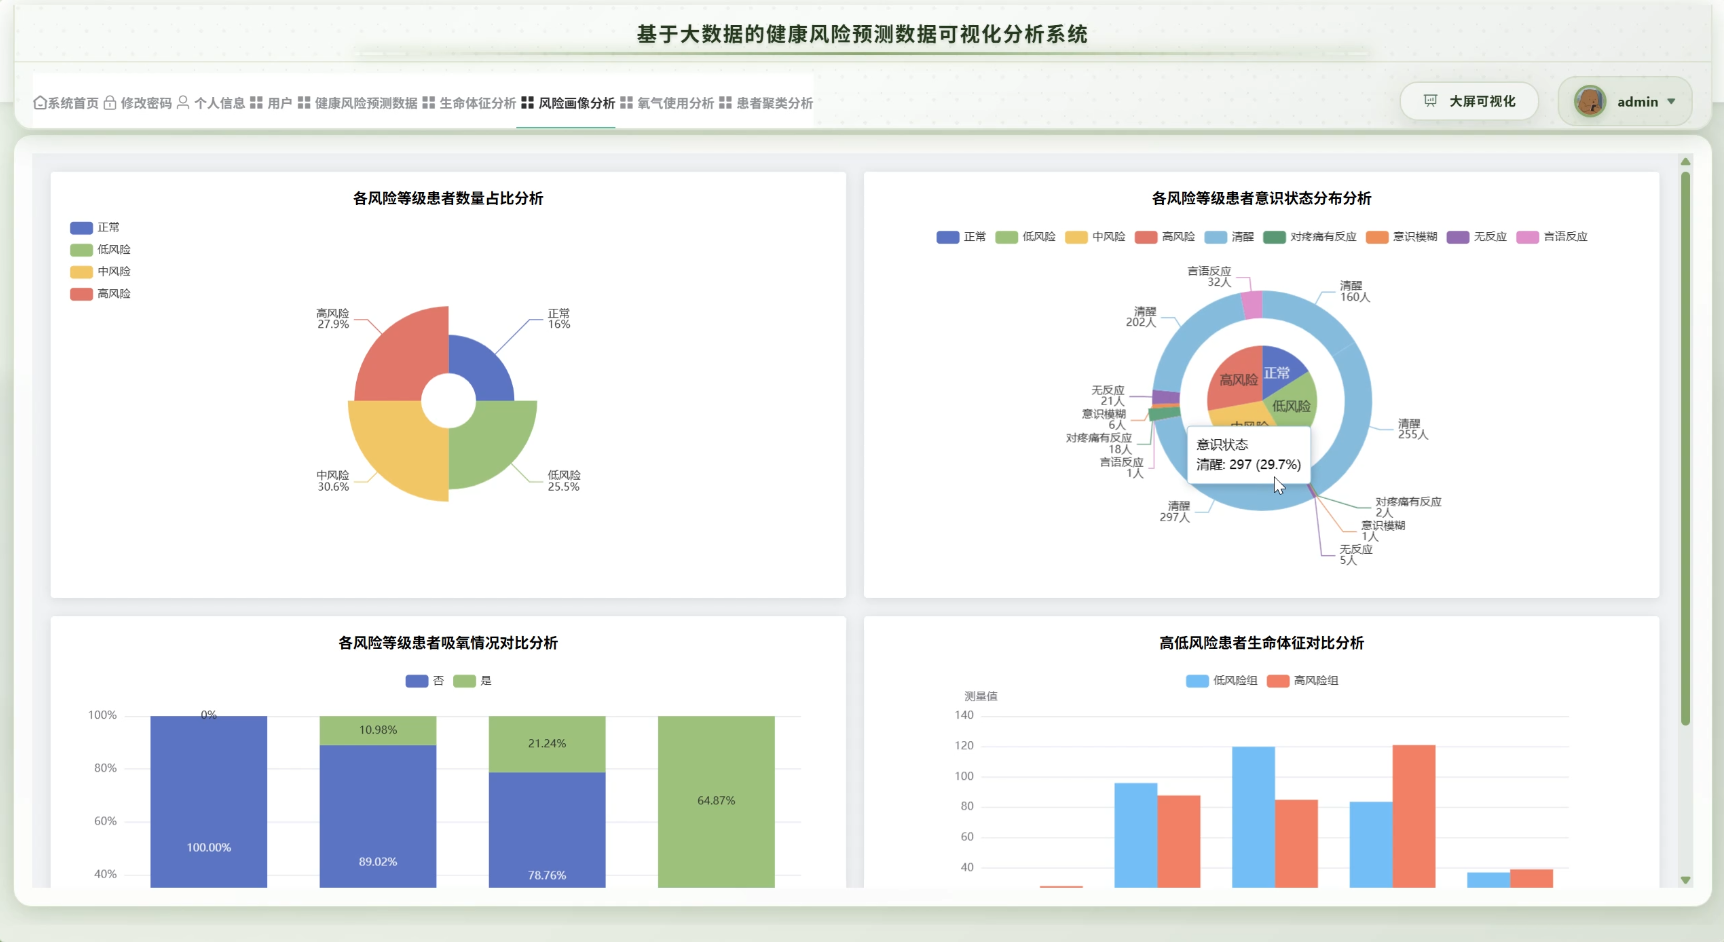
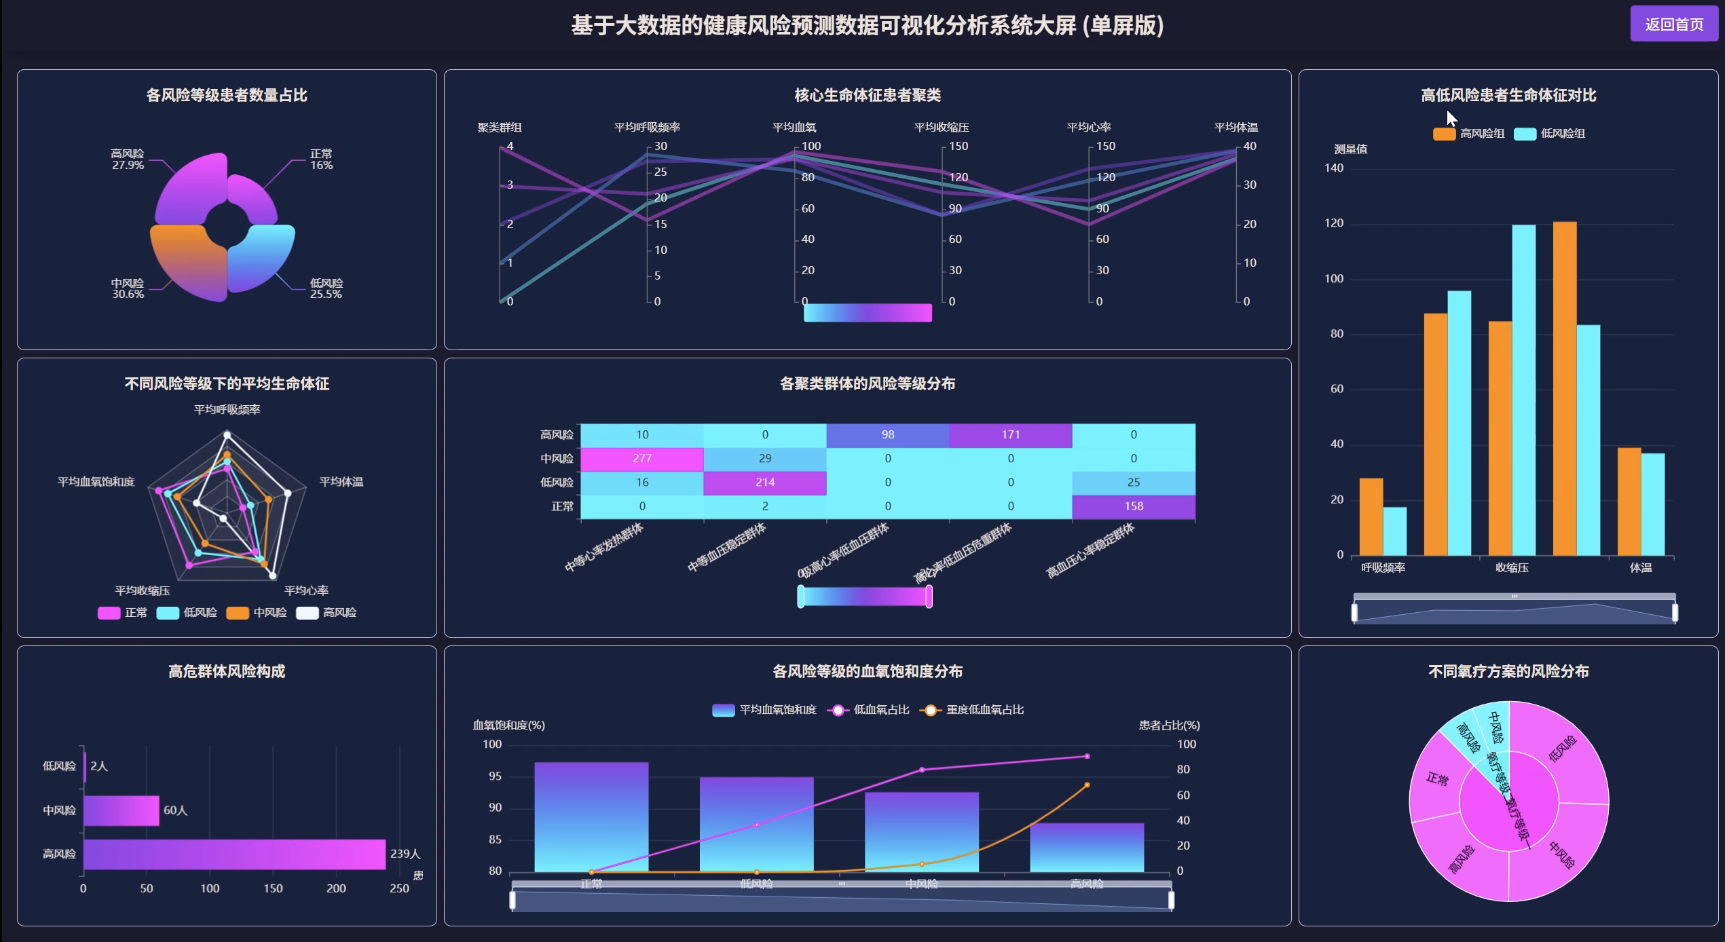
基于大数据的健康风险预测数据可视化分析系统是一个面向医疗健康领域的大数据分析平台,该系统采用Hadoop+Spark作为核心大数据处理框架,通过HDFS实现海量健康数据的分布式存储,利用Spark SQL进行高效的数据查询与分析,结合Pandas和NumPy进行深度数据挖掘与统计计算。系统提供Python+Django和Java+SpringBoot两种后端技术实现方案,前端采用Vue+ElementUI构建交互界面,通过Echarts图表组件实现丰富的数据可视化展示。系统核心功能包括健康风险预测数据管理、生命体征分析、风险画像分析、氧气使用分析以及患者聚类分析等六大分析模块,其中数据大屏可视化功能能够实时展示多维度健康数据指标,通过Spark的分布式计算能力对患者健康数据进行聚类分析,识别高风险人群特征,生成个性化的风险画像报告。系统整体架构采用前后端分离设计,MySQL数据库存储结构化数据,Hadoop集群处理海量非结构化健康数据,实现了从数据采集、存储、处理到可视化分析的完整大数据应用流程,为医疗健康风险预测提供了一套完整的技术解决方案,展现了大数据技术在智慧医疗领域的实际应用价值。
基于大数据的健康风险预测数据可视化分析系统演示视频
基于大数据的健康风险预测数据可视化分析系统【python、Hadoop、spark、MySQL、python项目、大数据毕设选题、论文书写】【源码+论文+答辩】
基于大数据的健康风险预测数据可视化分析系统演示图片
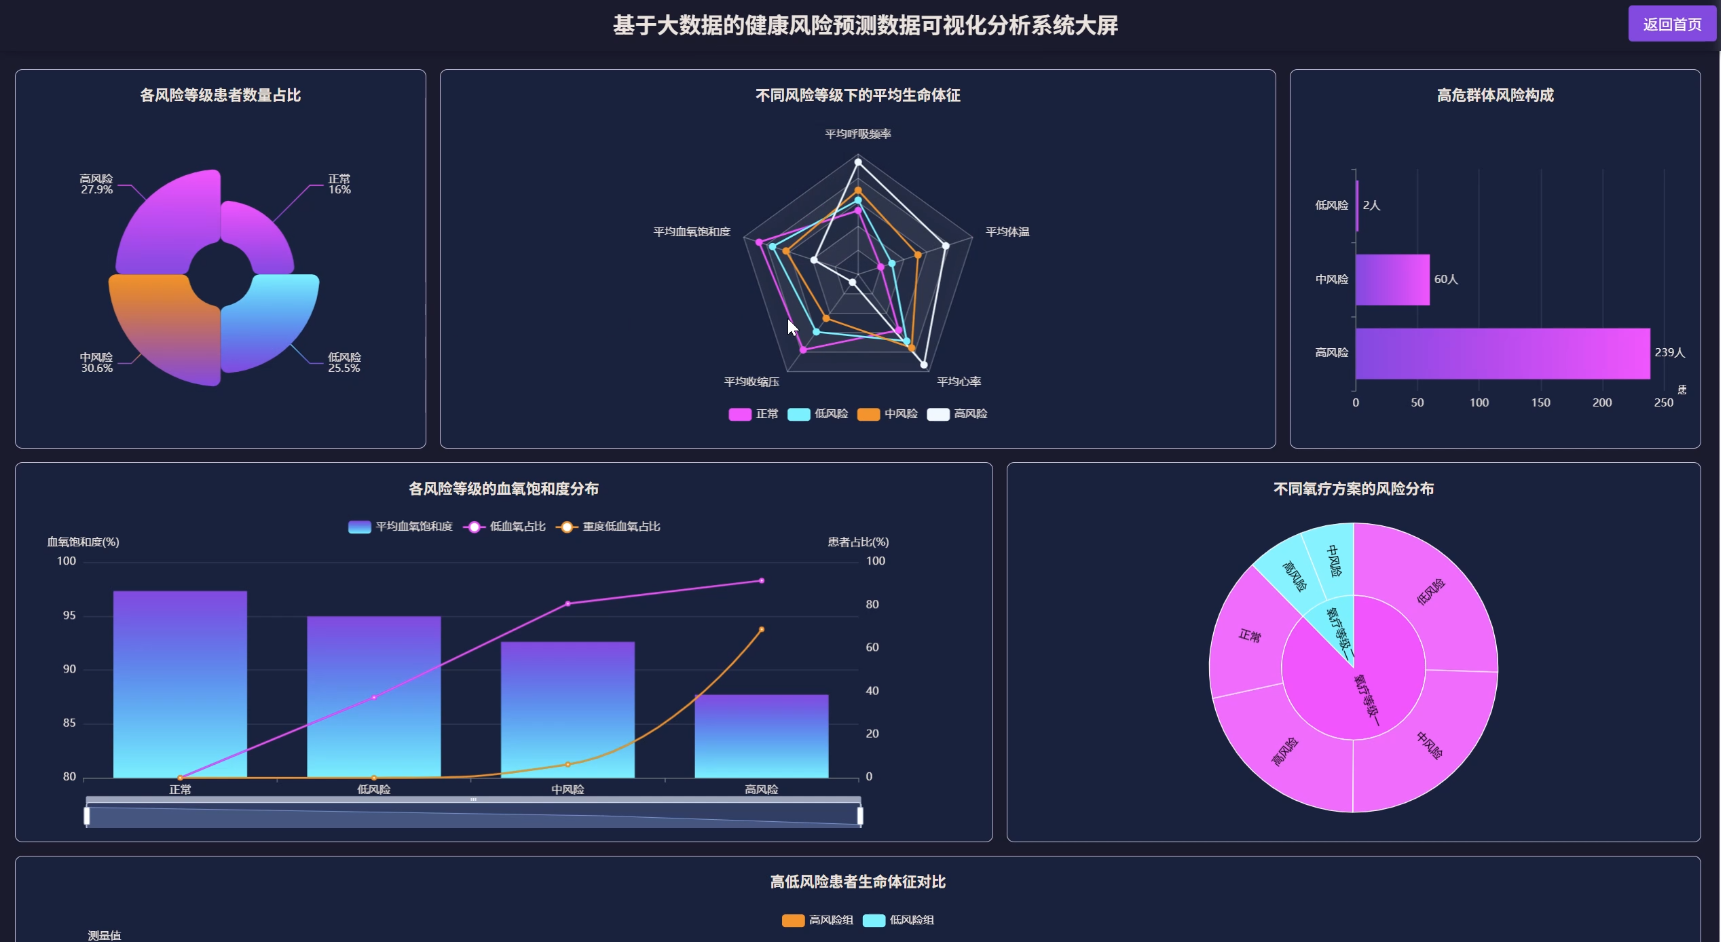
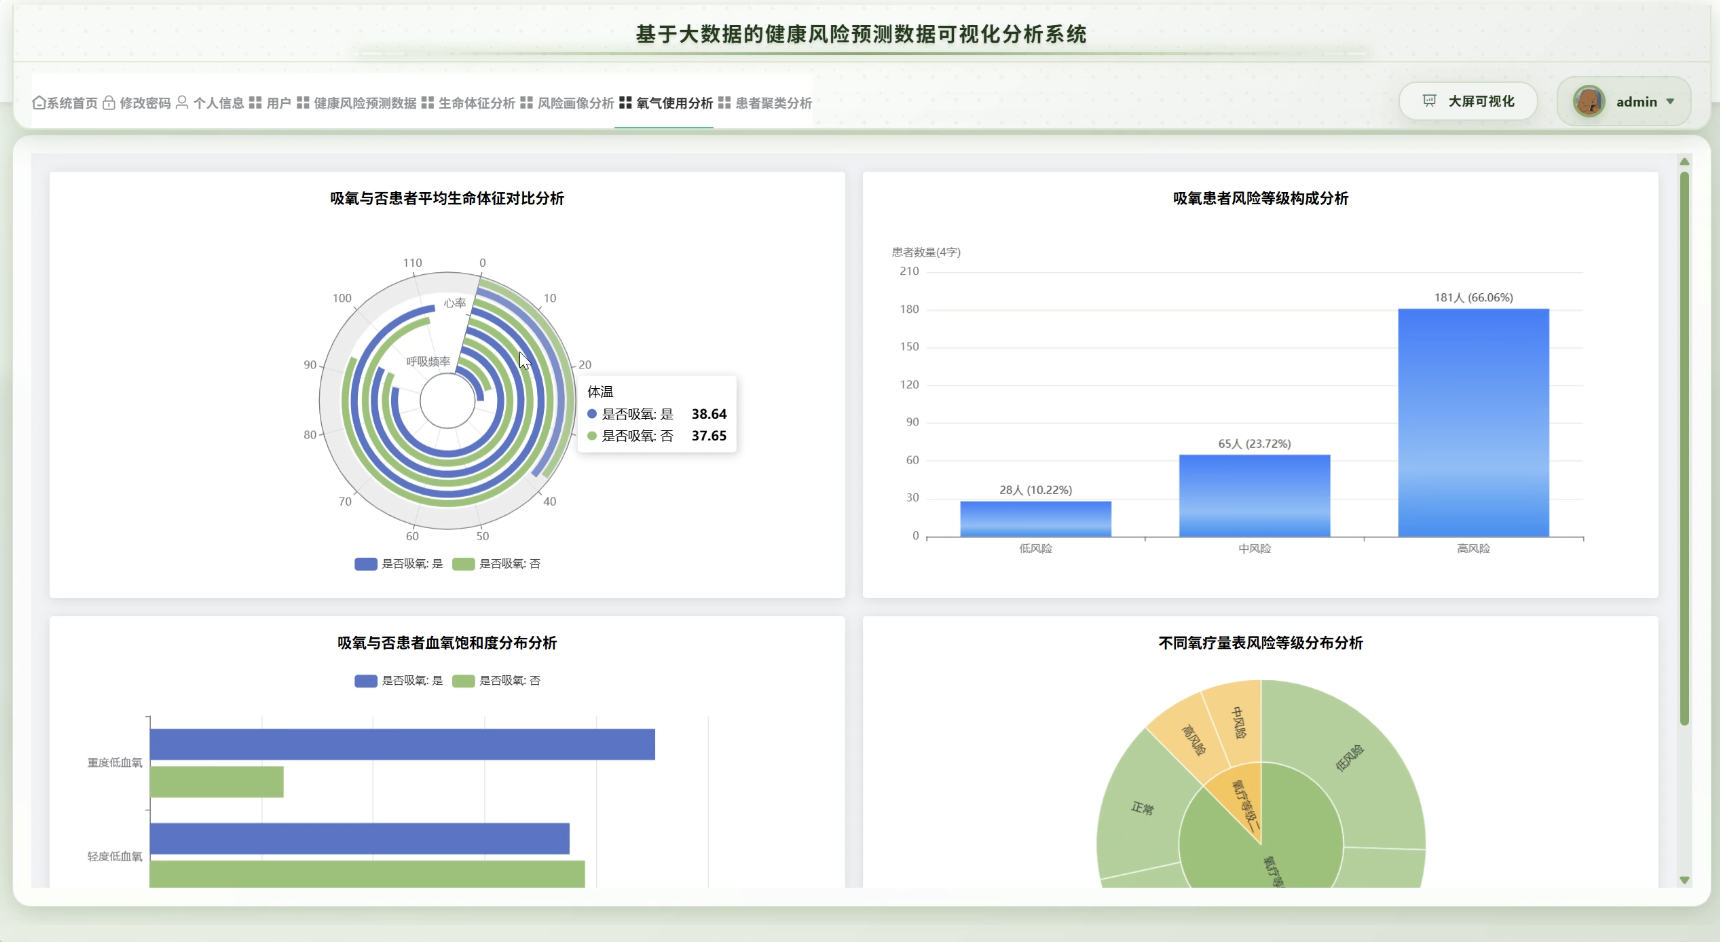
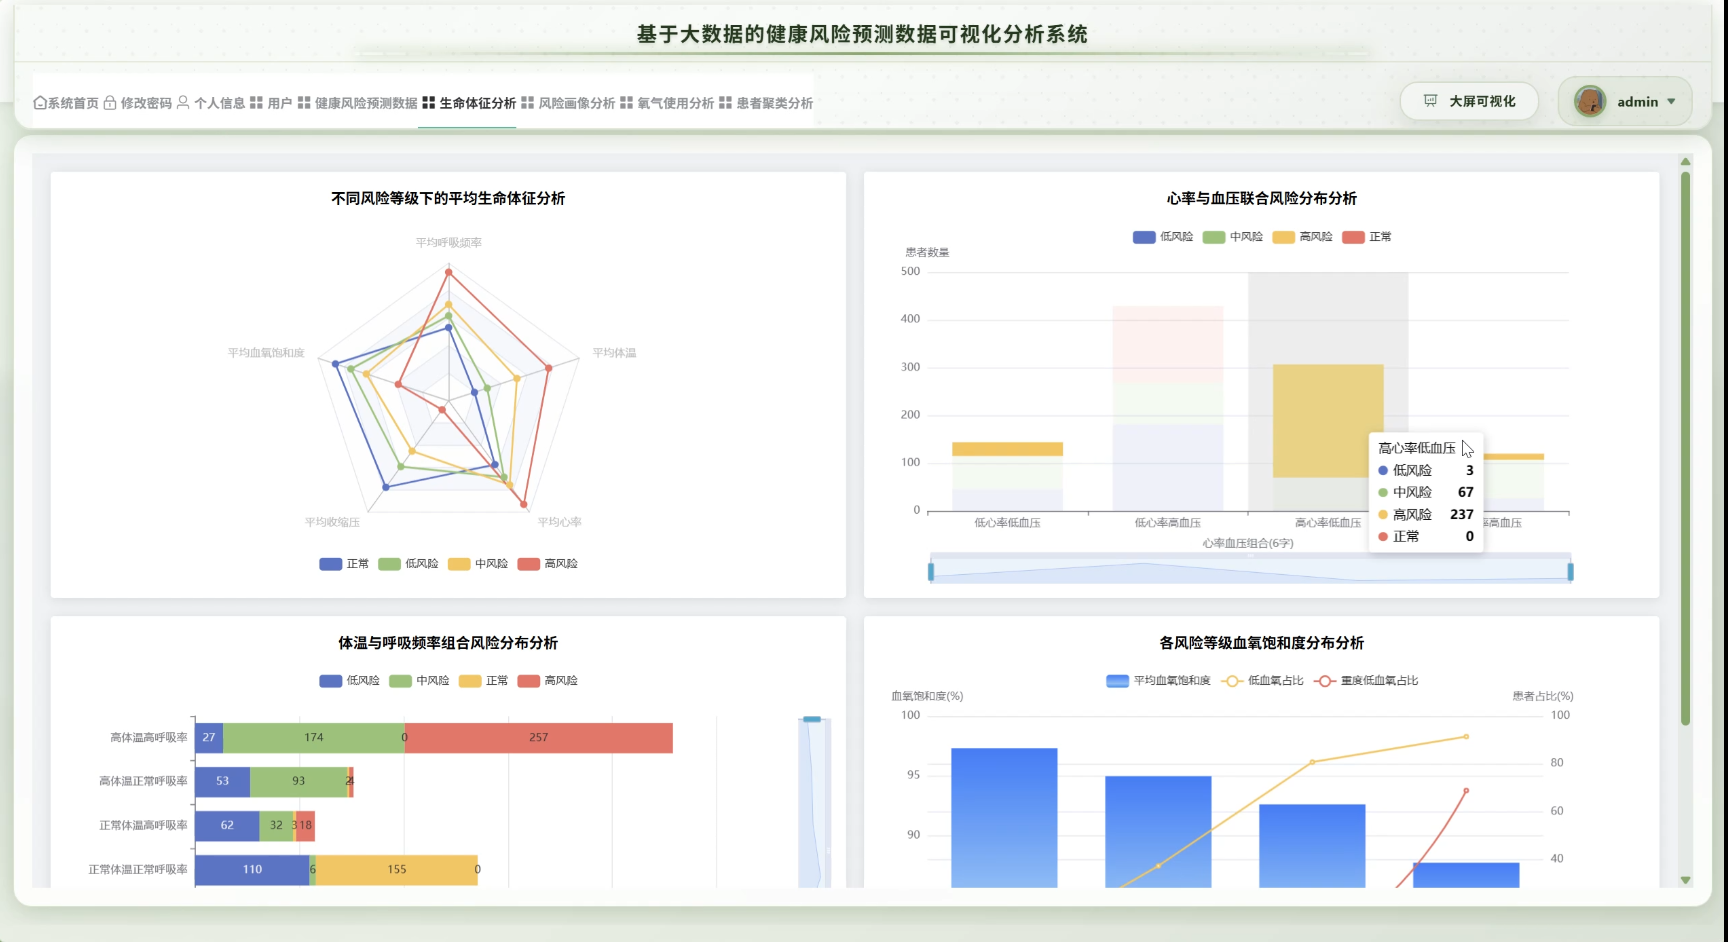
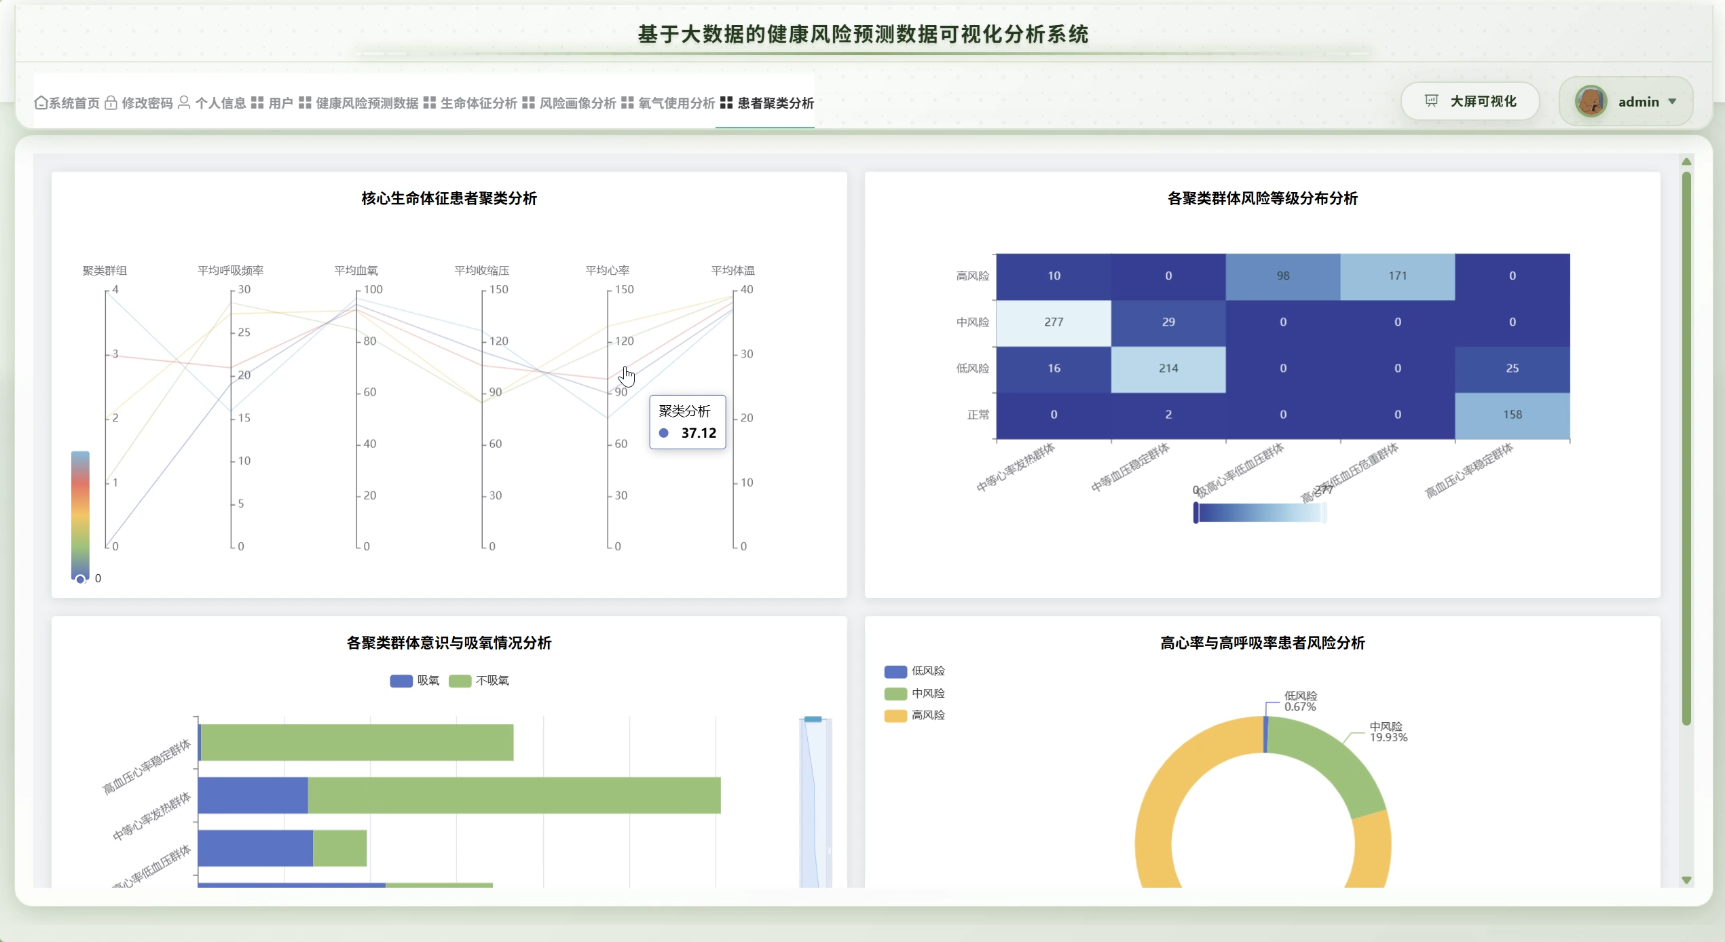
基于大数据的健康风险预测数据可视化分析系统代码展示
from pyspark.sql import SparkSession
from pyspark.sql.functions import col, when, avg, count, stddev, sum as spark_sum
from pyspark.ml.feature import VectorAssembler, StandardScaler
from pyspark.ml.clustering import KMeans
import pandas as pd
import numpy as np
from django.http import JsonResponse
from django.views import View
import json

spark = SparkSession.builder.appName("HealthRiskPrediction").config("spark.sql.warehouse.dir", "/user/hive/warehouse").config("spark.executor.memory", "2g").config("spark.driver.memory", "1g").getOrCreate()

def health_risk_prediction_analysis(request):
    patient_data = spark.read.format("jdbc").option("url", "jdbc:mysql://localhost:3306/health_db").option("driver", "com.mysql.jdbc.Driver").option("dbtable", "patient_health_data").option("user", "root").option("password", "123456").load()
    patient_df = patient_data.select("patient_id", "age", "blood_pressure_high", "blood_pressure_low", "heart_rate", "blood_sugar", "oxygen_saturation", "bmi")
    risk_score_df = patient_df.withColumn("bp_risk", when((col("blood_pressure_high") > 140) | (col("blood_pressure_low") > 90), 1).otherwise(0))
    risk_score_df = risk_score_df.withColumn("heart_risk", when((col("heart_rate") > 100) | (col("heart_rate") < 60), 1).otherwise(0))
    risk_score_df = risk_score_df.withColumn("sugar_risk", when(col("blood_sugar") > 6.1, 1).otherwise(0))
    risk_score_df = risk_score_df.withColumn("oxygen_risk", when(col("oxygen_saturation") < 95, 1).otherwise(0))
    risk_score_df = risk_score_df.withColumn("bmi_risk", when((col("bmi") > 28) | (col("bmi") < 18.5), 1).otherwise(0))
    risk_score_df = risk_score_df.withColumn("total_risk_score", col("bp_risk") + col("heart_risk") + col("sugar_risk") + col("oxygen_risk") + col("bmi_risk"))
    risk_score_df = risk_score_df.withColumn("risk_level", when(col("total_risk_score") >= 4, "高风险").when(col("total_risk_score") >= 2, "中风险").otherwise("低风险"))
    high_risk_patients = risk_score_df.filter(col("risk_level") == "高风险").select("patient_id", "age", "total_risk_score", "blood_pressure_high", "blood_sugar")
    risk_statistics = risk_score_df.groupBy("risk_level").agg(count("patient_id").alias("patient_count"), avg("age").alias("avg_age"), avg("total_risk_score").alias("avg_risk_score"))
    age_risk_analysis = risk_score_df.withColumn("age_group", when(col("age") < 40, "青年").when(col("age") < 60, "中年").otherwise("老年"))
    age_risk_stats = age_risk_analysis.groupBy("age_group", "risk_level").agg(count("patient_id").alias("count"))
    risk_result = risk_statistics.toPandas().to_dict('records')
    high_risk_result = high_risk_patients.limit(100).toPandas().to_dict('records')
    age_risk_result = age_risk_stats.toPandas().to_dict('records')
    return JsonResponse({"code": 200, "risk_statistics": risk_result, "high_risk_patients": high_risk_result, "age_risk_analysis": age_risk_result})

def vital_signs_analysis(request):
    vital_signs_data = spark.read.format("jdbc").option("url", "jdbc:mysql://localhost:3306/health_db").option("driver", "com.mysql.jdbc.Driver").option("dbtable", "vital_signs_records").option("user", "root").option("password", "123456").load()
    vital_df = vital_signs_data.select("patient_id", "record_time", "heart_rate", "blood_pressure_high", "blood_pressure_low", "body_temperature", "respiratory_rate")
    heart_rate_stats = vital_df.groupBy("patient_id").agg(avg("heart_rate").alias("avg_heart_rate"), stddev("heart_rate").alias("stddev_heart_rate"), spark_sum(when(col("heart_rate") > 100, 1).otherwise(0)).alias("abnormal_count"))
    bp_analysis = vital_df.withColumn("bp_status", when((col("blood_pressure_high") >= 140) | (col("blood_pressure_low") >= 90), "高血压").when((col("blood_pressure_high") < 90) | (col("blood_pressure_low") < 60), "低血压").otherwise("正常"))
    bp_distribution = bp_analysis.groupBy("bp_status").agg(count("patient_id").alias("record_count"))
    temp_analysis = vital_df.withColumn("temp_status", when(col("body_temperature") >= 37.3, "发热").when(col("body_temperature") <= 36.0, "体温过低").otherwise("正常"))
    temp_stats = temp_analysis.groupBy("temp_status").agg(count("patient_id").alias("count"), avg("body_temperature").alias("avg_temp"))
    respiratory_analysis = vital_df.withColumn("respiratory_status", when(col("respiratory_rate") > 20, "呼吸急促").when(col("respiratory_rate") < 12, "呼吸缓慢").otherwise("正常"))
    respiratory_stats = respiratory_analysis.groupBy("respiratory_status").agg(count("patient_id").alias("count"))
    abnormal_vital_signs = vital_df.filter((col("heart_rate") > 100) | (col("blood_pressure_high") > 140) | (col("body_temperature") > 37.3) | (col("respiratory_rate") > 20))
    abnormal_patient_count = abnormal_vital_signs.select("patient_id").distinct().count()
    vital_trend_data = vital_df.orderBy("record_time").limit(1000).toPandas()
    vital_trend_data['record_time'] = vital_trend_data['record_time'].astype(str)
    heart_rate_result = heart_rate_stats.limit(50).toPandas().to_dict('records')
    bp_result = bp_distribution.toPandas().to_dict('records')
    temp_result = temp_stats.toPandas().to_dict('records')
    respiratory_result = respiratory_stats.toPandas().to_dict('records')
    trend_result = vital_trend_data.to_dict('records')
    return JsonResponse({"code": 200, "heart_rate_analysis": heart_rate_result, "blood_pressure_distribution": bp_result, "temperature_analysis": temp_result, "respiratory_analysis": respiratory_result, "abnormal_patient_count": abnormal_patient_count, "vital_trend": trend_result})

def patient_clustering_analysis(request):
    patient_features_data = spark.read.format("jdbc").option("url", "jdbc:mysql://localhost:3306/health_db").option("driver", "com.mysql.jdbc.Driver").option("dbtable", "patient_health_data").option("user", "root").option("password", "123456").load()
    clustering_df = patient_features_data.select("patient_id", "age", "bmi", "blood_pressure_high", "blood_pressure_low", "heart_rate", "blood_sugar", "oxygen_saturation")
    clustering_df = clustering_df.na.drop()
    feature_columns = ["age", "bmi", "blood_pressure_high", "blood_pressure_low", "heart_rate", "blood_sugar", "oxygen_saturation"]
    assembler = VectorAssembler(inputCols=feature_columns, outputCol="features")
    assembled_data = assembler.transform(clustering_df)
    scaler = StandardScaler(inputCol="features", outputCol="scaled_features", withStd=True, withMean=True)
    scaler_model = scaler.fit(assembled_data)
    scaled_data = scaler_model.transform(assembled_data)
    kmeans = KMeans(k=4, seed=42, featuresCol="scaled_features", predictionCol="cluster")
    kmeans_model = kmeans.fit(scaled_data)
    clustered_data = kmeans_model.transform(scaled_data)
    cluster_result = clustered_data.select("patient_id", "age", "bmi", "blood_pressure_high", "heart_rate", "blood_sugar", "cluster")
    cluster_statistics = cluster_result.groupBy("cluster").agg(count("patient_id").alias("patient_count"), avg("age").alias("avg_age"), avg("bmi").alias("avg_bmi"), avg("blood_pressure_high").alias("avg_bp_high"), avg("heart_rate").alias("avg_heart_rate"), avg("blood_sugar").alias("avg_blood_sugar"))
    cluster_0_patients = cluster_result.filter(col("cluster") == 0).limit(20)
    cluster_1_patients = cluster_result.filter(col("cluster") == 1).limit(20)
    cluster_2_patients = cluster_result.filter(col("cluster") == 2).limit(20)
    cluster_3_patients = cluster_result.filter(col("cluster") == 3).limit(20)
    cluster_stats_result = cluster_statistics.toPandas().to_dict('records')
    cluster_0_result = cluster_0_patients.toPandas().to_dict('records')
    cluster_1_result = cluster_1_patients.toPandas().to_dict('records')
    cluster_2_result = cluster_2_patients.toPandas().to_dict('records')
    cluster_3_result = cluster_3_patients.toPandas().to_dict('records')
    all_cluster_patients = cluster_result.limit(200).toPandas().to_dict('records')
    return JsonResponse({"code": 200, "cluster_statistics": cluster_stats_result, "cluster_0_patients": cluster_0_result, "cluster_1_patients": cluster_1_result, "cluster_2_patients": cluster_2_result, "cluster_3_patients": cluster_3_result, "all_patients": all_cluster_patients})
基于大数据的健康风险预测数据可视化分析系统文档展示
💖💖作者:计算机编程小咖
💙💙个人简介:曾长期从事计算机专业培训教学,本人也热爱上课教学,语言擅长Java、微信小程序、Python、Golang、安卓Android等,开发项目包括大数据、深度学习、网站、小程序、安卓、算法。平常会做一些项目定制化开发、代码讲解、答辩教学、文档编写、也懂一些降重方面的技巧。平常喜欢分享一些自己开发中遇到的问题的解决办法,也喜欢交流技术,大家有技术代码这一块的问题可以问我!
💛💛想说的话:感谢大家的关注与支持!
💜💜
网站实战项目
安卓/小程序实战项目
大数据实战项目
深度学习实战项目

Agent 垂直技术社区,欢迎活跃、内容共建。
更多推荐
 18
18 0
0- 0


 已为社区贡献28条内容

所有评论(0)