求助!调试遇阻(unable to step into),求大型 React + 异步项目 debug 技巧
调试遇阻(unable to step into),求大型 React + 异步项目 debug 技巧
背景
各位 CSDN 的技术大佬好!我想探索一些自己未曾接触的领域,于是在跑通cherryStudio这个应用的源代码(yarn dev成功显示应用界面)后,想着调试 React 项目尝试一下(yarn debug)。因为我没有过相关debug经验,遇到了一些对我来说很难的问题,折腾了半天没头绪,还想请教下大型 React + 异步函数项目的 debug 思路,恳请大佬们指点迷津~
我是参考的以下文档进行的源码运行前的依赖准备工作:
链接: cherryStudio仓库开发文档.
链接: cherryStudio仓库.
关于浏览器的inspect界面
我在powershell运行yarn debug后,应用界面成功出现,首先尝试了官方文档的方法:chrome://inspect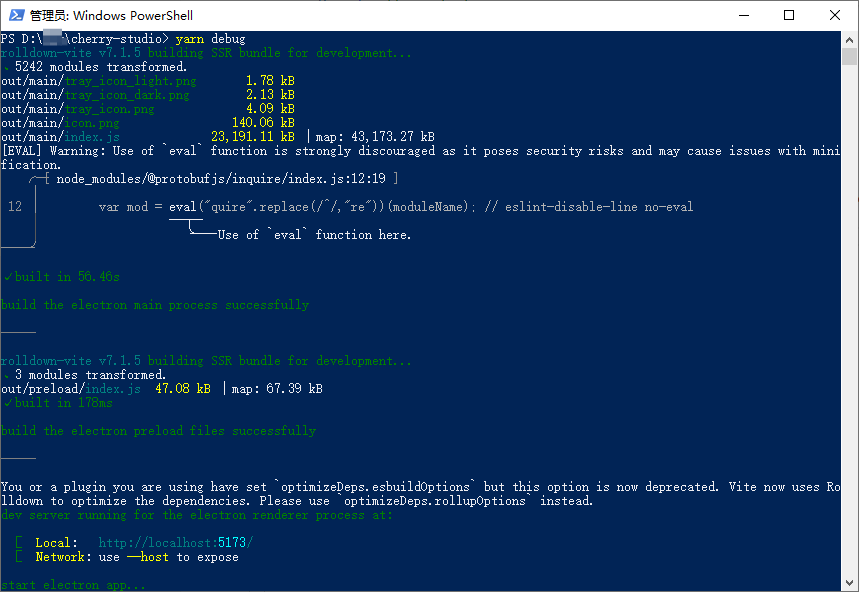
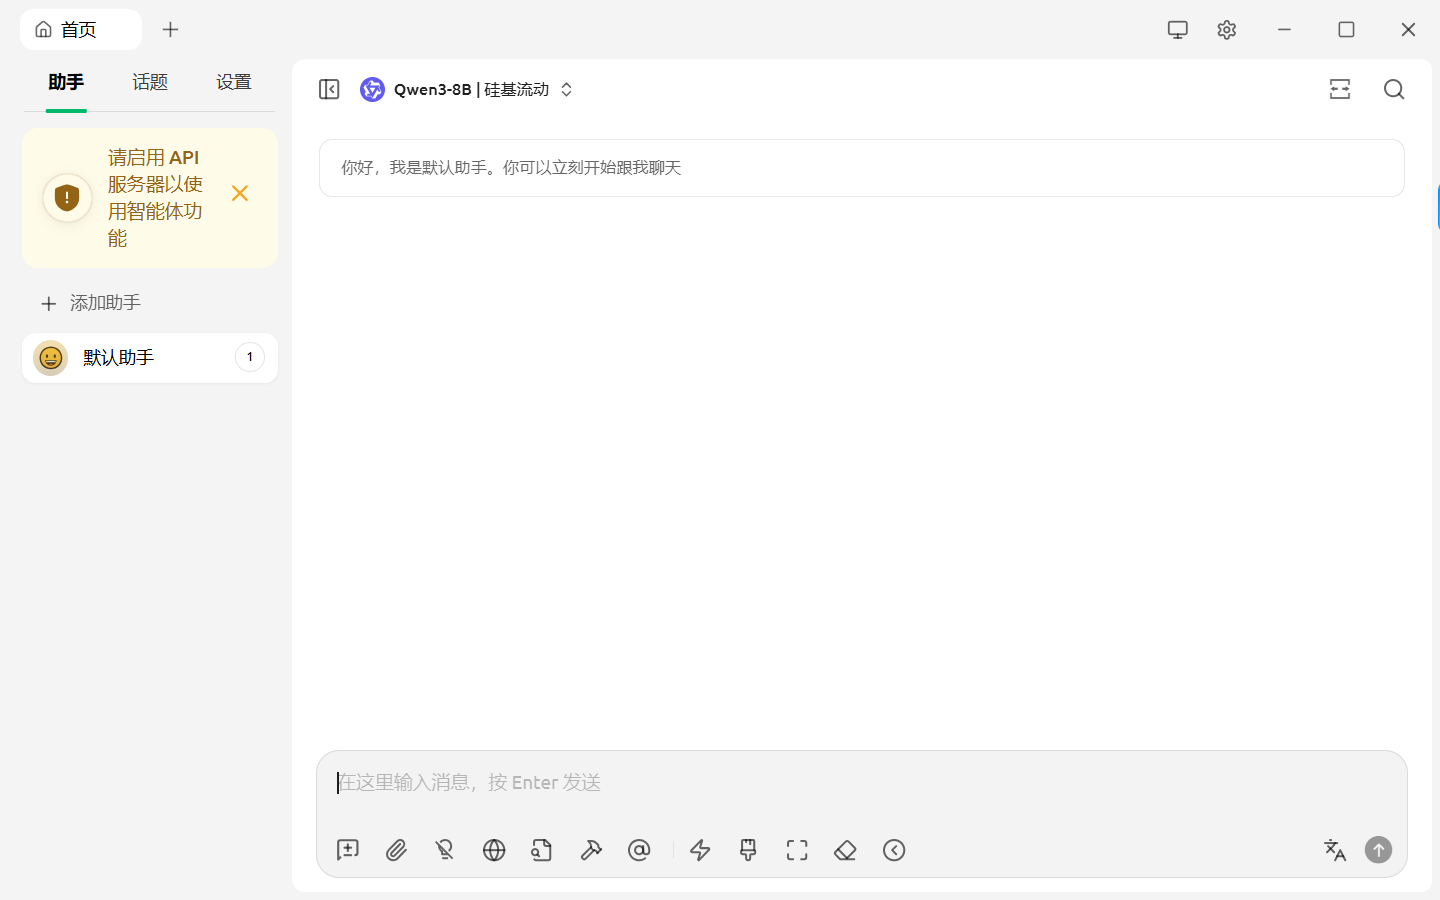
1. 谷歌浏览器
输入chrome://inspect后,出现了下面这个界面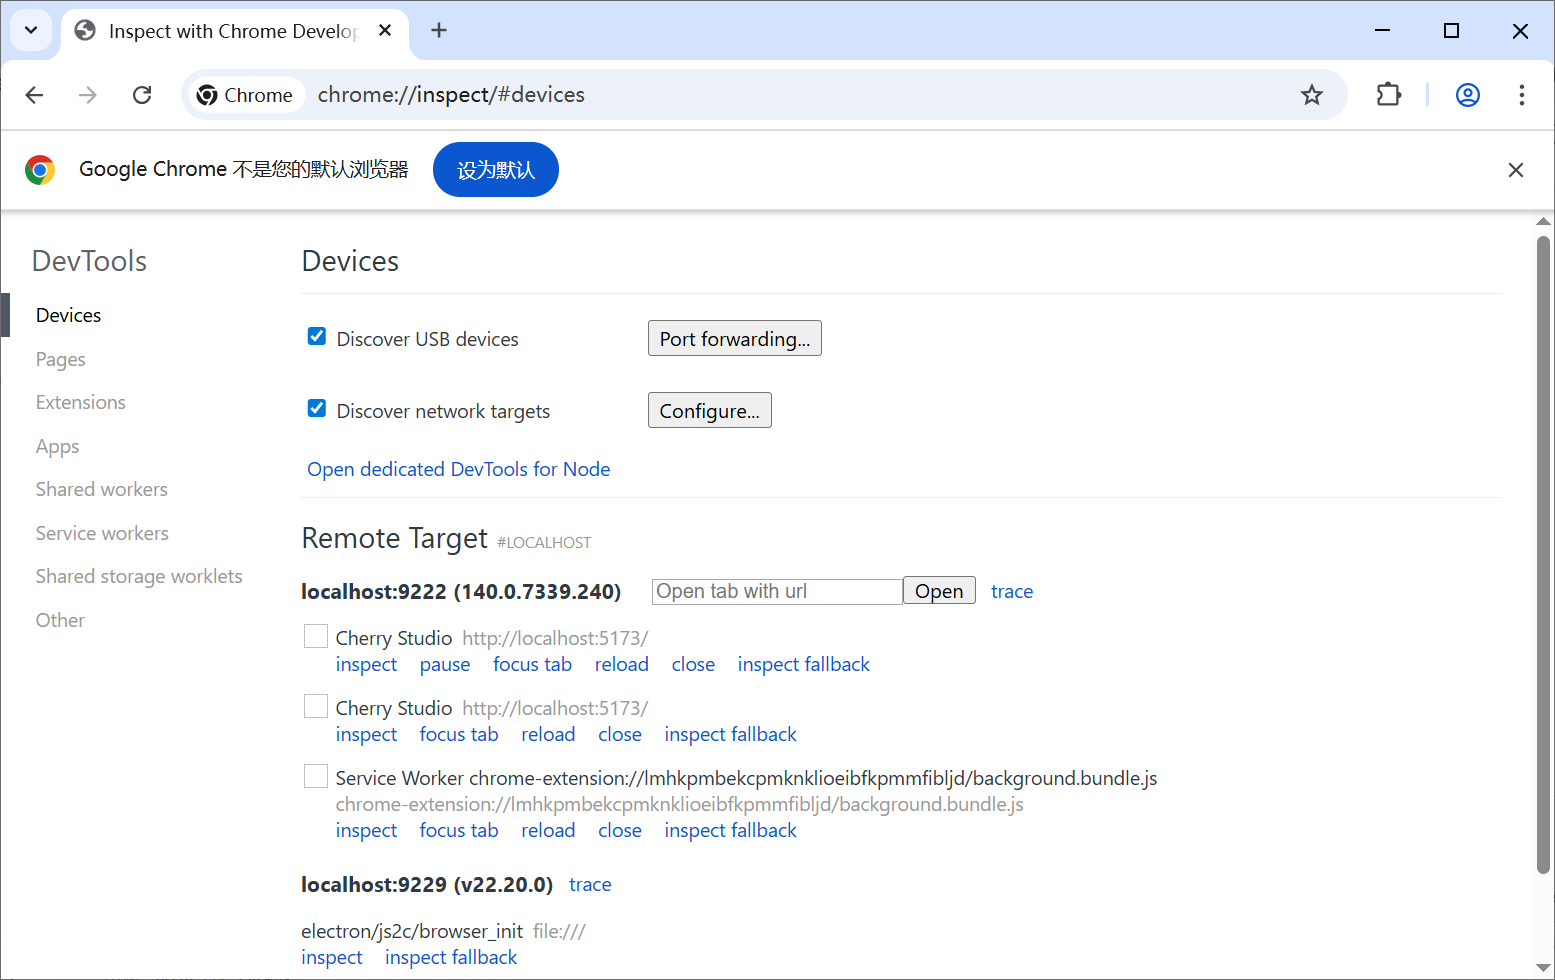
但点击第一个的inspect后:弹出404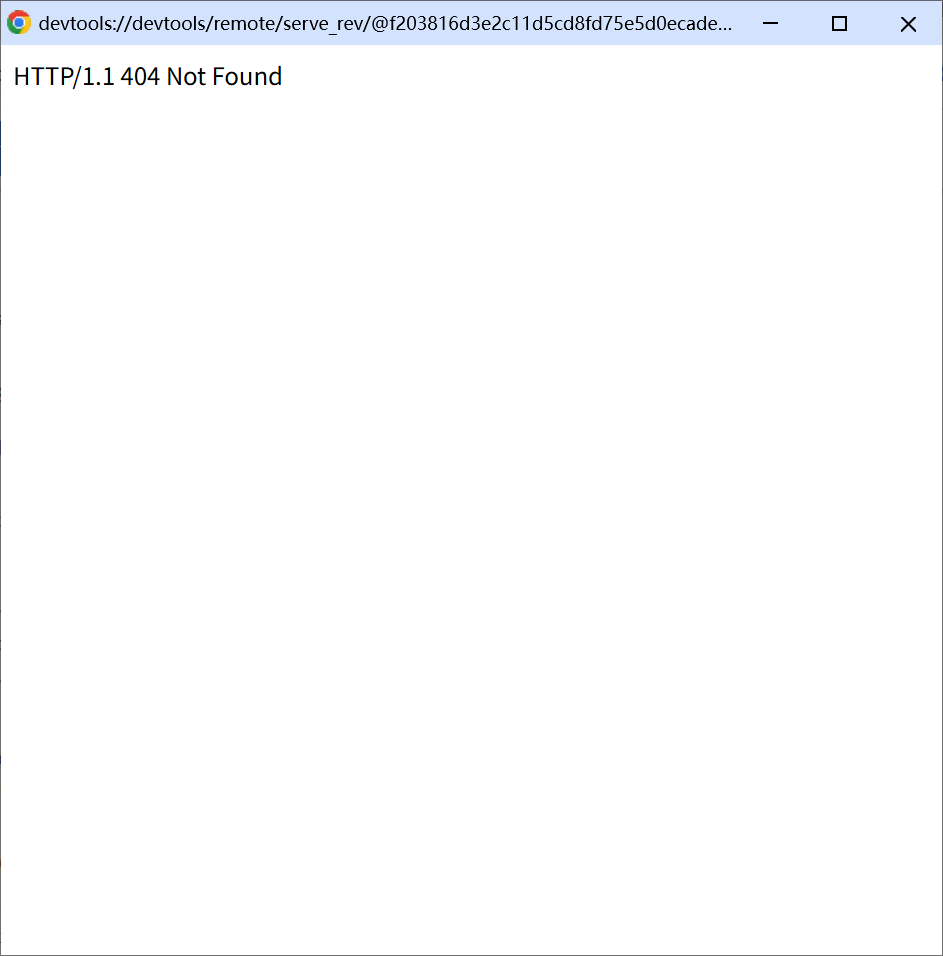
2. edge浏览器
输入edge://inspect后,同样出现了下面这个界面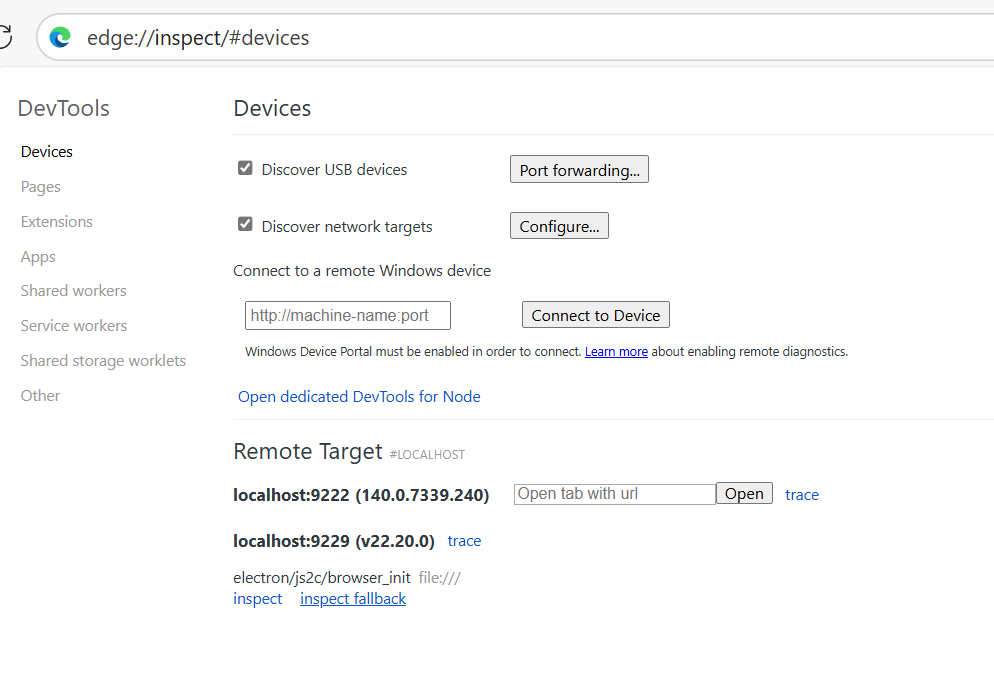
在这里同样点击inspect,弹出了调试界面
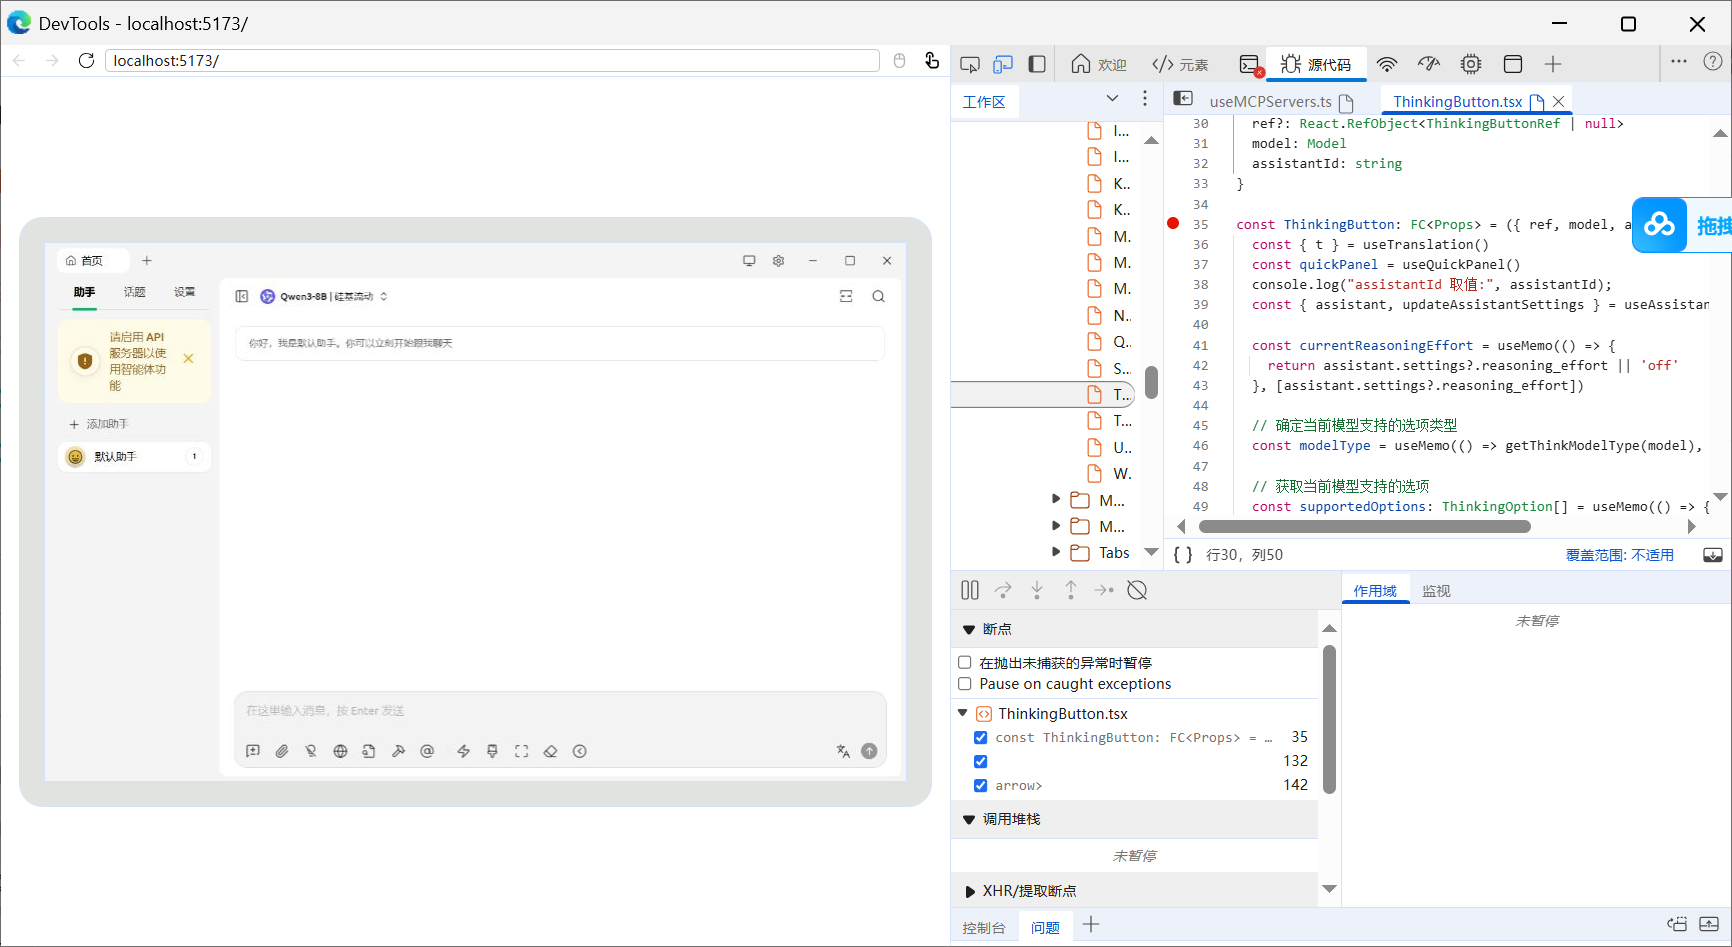
我打了一个断点在cherry-studio\src\renderer\src\pages\home\Inputbar\ThinkingButton.tsx的第35行,是ThinkingButton的定义起始的地方,但是我不理解的是为什么左边的界面我点击任何一处都没有反应,我觉得是不是因为不清楚大型项目Debug的操作导致我进入的地方不对?
并且我也不清楚为什么在谷歌浏览器打不开的界面在edge浏览器反而可以。
VsCode的尝试
仍然是打了一个断点在cherry-studio\src\renderer\src\pages\home\Inputbar\ThinkingButton.tsx的第35行那里。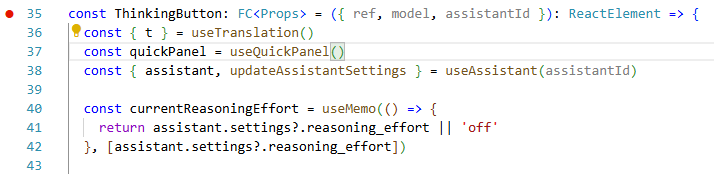
在.vscode/launch.json中配置了以下内容:
{
  "compounds": [
    {
      "configurations": ["Debug Main Process", "Debug Renderer Process"],
      "name": "Debug All",
      "presentation": {
        "order": 1
      }
    }
  ],
  "configurations": [
    {
      "cwd": "${workspaceRoot}",
      "env": {
        "REMOTE_DEBUGGING_PORT": "9222",
        "ELECTRON_ENABLE_LOGGING": "true" // 2025/11/03
      },
      "envFile": "${workspaceFolder}/.env",
      "name": "Debug Main Process",
      "request": "launch",
      // "runtimeArgs": ["--inspect", "--sourcemap"],
      "args": [   //M2025/11/03
        "--debug=resolve,transform",
        "--",
        "--inspect",
        "--sourcemap",
        "--remote-debugging-port=9222",
        "--remote-allow-origins=devtools://devtools,http://localhost:9222"
      ],
      "runtimeExecutable": "${workspaceRoot}/node_modules/.bin/electron-vite",
      "type": "node",
      "windows": {
        "runtimeExecutable": "${workspaceRoot}/node_modules/.bin/electron-vite.cmd"
      },
      "console": "integratedTerminal"
    },
    {
      "name": "Debug Renderer Process",
      "port": 9222,
      "presentation": {
        "hidden": true
      },
      "request": "attach",
      "timeout": 3000000,
      "sourceMapPathOverrides": { //2025/11/03
        "file:///D:/Users/cherry-studio/src/renderer/@fs/*": "D:/*",
        "file:///D:/Users/cherry-studio/src/renderer/%40fs/*": "D:/*",
        "webpack:///./src/*": "${webRoot}/*",
        "webpack:///*": "*",
        "vite:///*": "${webRoot}/*"
      },
      "type": "chrome",
      "webRoot": "${workspaceFolder}/src/renderer"
    }
  ],
  "version": "0.2.0"
}
这个配置略有不同于官方提供的配置文件,上述标注日期11.03的地方均为新增的。经过验证,在vscode中运行Debug All也能成功出现界面,并且会停在我打的断点位置,但接下来奇怪的是:无论我点击step into还是step over亦或是continue,都是unable to step into、unable to step over、unable to resume,问了AI,也没看懂,大体意思是这些函数内部产生了无限循环的依赖?那正常运行的时候没事,调试的时候就不行了,所以我想到了请教下大佬们大型 React + Electron + 异步函数项目的 debug 思路。请各位大佬帮我猜测一下这些问题的原因,如果能提出解决方法或愿意指导我,将不胜感激。

Agent 垂直技术社区,欢迎活跃、内容共建。
更多推荐


 20
20 0
0- 0


 已为社区贡献1条内容

所有评论(0)