Vue3 雷达图
·
效果图:
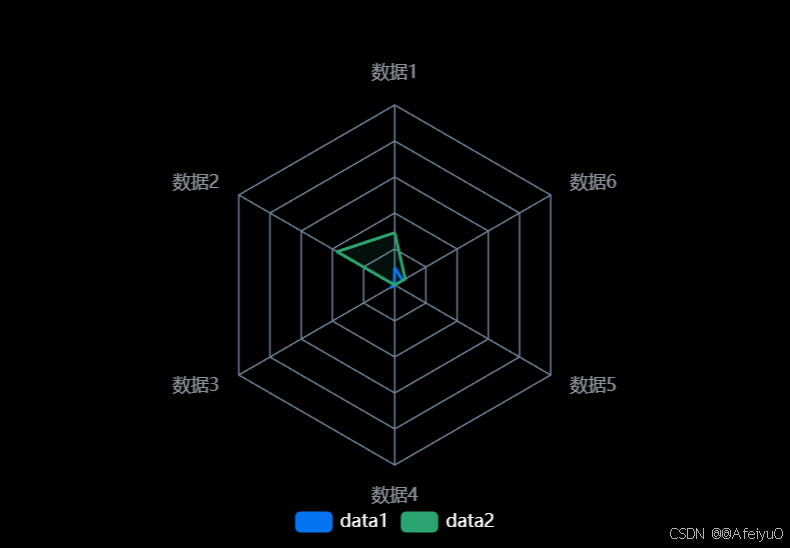
<template>
    <v-chart ref="vChartRef" :option="option" style="width: 100%; height: 400px;background-color: #000;"> </v-chart>
  </template>

  <script setup lang="ts">
  import { ref, computed } from "vue";
  import VChart from "vue-echarts";
  import { use } from "echarts/core";
  import { CanvasRenderer } from "echarts/renderers";
  import { RadarChart } from "echarts/charts";
  import {
    DatasetComponent,
    GridComponent,
    TooltipComponent,
    LegendComponent,
  } from "echarts/components";

  use([
    DatasetComponent,
    CanvasRenderer,
    RadarChart,
    GridComponent,
    TooltipComponent,
    LegendComponent,
  ]);

  const vChartRef = ref<typeof VChart>();
  const colorList = [
    "#0674F1",
    "#2BA471",
    "#F5BA18",
    "#E37318",
    "#029CD4",
    "#E37318",
    "#E37318",
    "#E37318",
  ];

  const chartData = ref<any>([
    {
      name: "data1",
      maxValue: [4200, 3000, 20000, 35000, 50000, 18000],
      label: ["数据1", "数据2", "数据3", "数据4", "数据5", "数据6"],
      value: [410, 10, 510, 10, 10, 910],
    },
    {
      name: "data2",
      maxValue: [5000, 14000, 28000, 26000, 42000, 21000],
      label: ["数据1", "数据2", "数据3", "数据4", "数据5", "数据6"],
      value: [1220, 1110, 10, 10, 10, 1210],
    },
  ]);

  // 构建指示器数据
  const getIndicator = () => {
    // 使用第一个数据集的label和maxValue来构建指示器
    const firstData = chartData.value[0];
    return firstData.label.map((label: string, index: number) => ({
      name: label,
      max: firstData.maxValue[index]
    }));
  };

  // 构建图例数据
  const getLegendData = () => {
    return chartData.value.map((item: any) => item.name);
  };

  // 构建系列数据
  const getSeries = () => {
    return [{
      name: "雷达图",
      type: "radar",
      symbol: "none",
      areaStyle: {
        opacity: 0.1,
      },
      data: chartData.value.map((item: any, index: number) => {
        const color = colorList[index] || "#0674F1";
        return {
          name: item.name,
          value: item.value,
          itemStyle: {
            color: color
          },
          lineStyle: {
            color: color
          },
          areaStyle: {
            color: color
          }
        };
      })
    }];
  };

  const option = computed(() => ({
    backgroundColor: '#000',
    tooltip: {
      show: true,
      trigger: 'item',
      textStyle: {
        color: '#6a8098'
      }
    },
    legend: {
      data: getLegendData(),
      bottom: 10,
      textStyle: {
        color: '#fff'  // 设置图例文字为白色,在黑色背景上更可见
      }
    },
    radar: {
      shape: "polygon",
      radius: ["0%", "60%"],
      center: ["50%", "55%"],
      splitArea: {
        show: false
      },
      splitLine: {
        show: true,
        lineStyle: {
          color: ["rgba(106, 128, 152, 1)"].reverse(),
        },
      },
      axisName: {
        show: true,
        color: "#E6F1FF99",
        fontSize: 12,
        formatter: (value: string) => {
          // 处理长文本换行
          if (value.length > 4) {
            return value.substring(0, 4) + '\n' + value.substring(4);
          }
          return value;
        }
      },
      axisLine: {
        show: true,
        lineStyle: {
          color: '#6a8098'
        }
      },
      axisTick: { show: false },
      alignTicks: false,
      indicator: getIndicator(),
    },
    series: getSeries(),
  }));
  </script>

  <style scoped>
  .echarts {
    width: 100%;
    height: 100%;
  }
  </style>
Agent 垂直技术社区,欢迎活跃、内容共建。
更多推荐


 2
2 0
0- 0


 已为社区贡献12条内容

所有评论(0)