C#实现串口数据读取与曲线显示:从基础到高级功能
c# 制作的读取串口数据显示曲线 可显示多条曲线,曲线可左右拖动放大缩小。 显示曲线最大最小值。 保存曲线并读取。
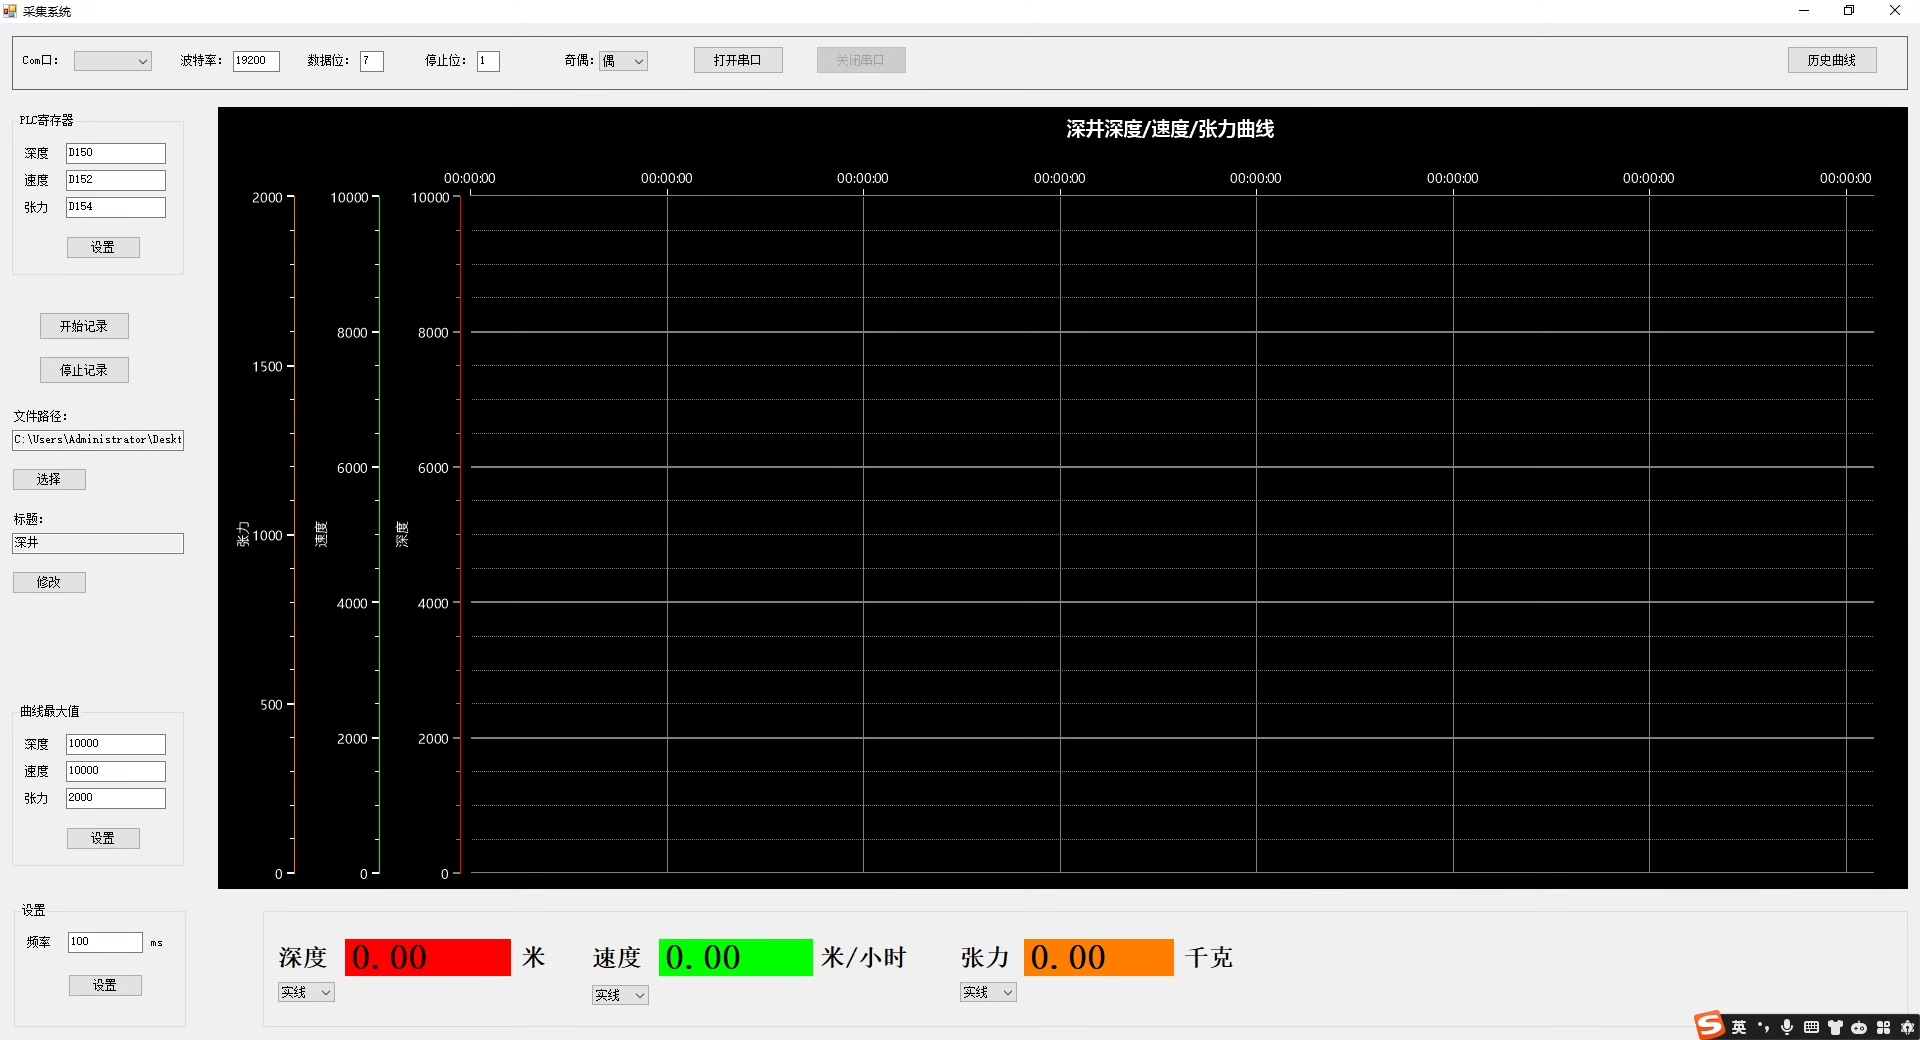
在很多工业和物联网应用场景中,我们需要通过串口获取设备数据,并以曲线的形式直观展示。今天咱们就来聊聊如何用C#实现读取串口数据并显示曲线,同时满足显示多条曲线、曲线可交互操作以及数据保存读取等进阶功能。
串口数据读取基础
在C#中,我们使用System.IO.Ports命名空间来处理串口通信。首先,需要引用这个命名空间:
using System.IO.Ports;接下来,初始化串口设置,比如波特率、数据位、停止位等:
private SerialPort serialPort1 = new SerialPort();
private void InitializeSerialPort()
{
    serialPort1.PortName = "COM1"; // 根据实际情况修改
    serialPort1.BaudRate = 9600;
    serialPort1.Parity = Parity.None;
    serialPort1.DataBits = 8;
    serialPort1.StopBits = StopBits.One;
    serialPort1.Open();
}这里,我们简单设置了串口的基本参数并打开串口。当串口有数据进来时,我们可以通过订阅DataReceived事件来处理:
serialPort1.DataReceived += new SerialDataReceivedEventHandler(serialPort1_DataReceived);
private void serialPort1_DataReceived(object sender, SerialDataReceivedEventArgs e)
{
    int bytes = serialPort1.BytesToRead;
    byte[] buffer = new byte[bytes];
    serialPort1.Read(buffer, 0, bytes);
    // 这里buffer就是接收到的数据,后续可根据数据格式处理
}
显示曲线
为了显示曲线,我们可以使用System.Windows.Forms.DataVisualization.Charting命名空间,需要在项目中添加对System.Windows.Forms.DataVisualization程序集的引用。
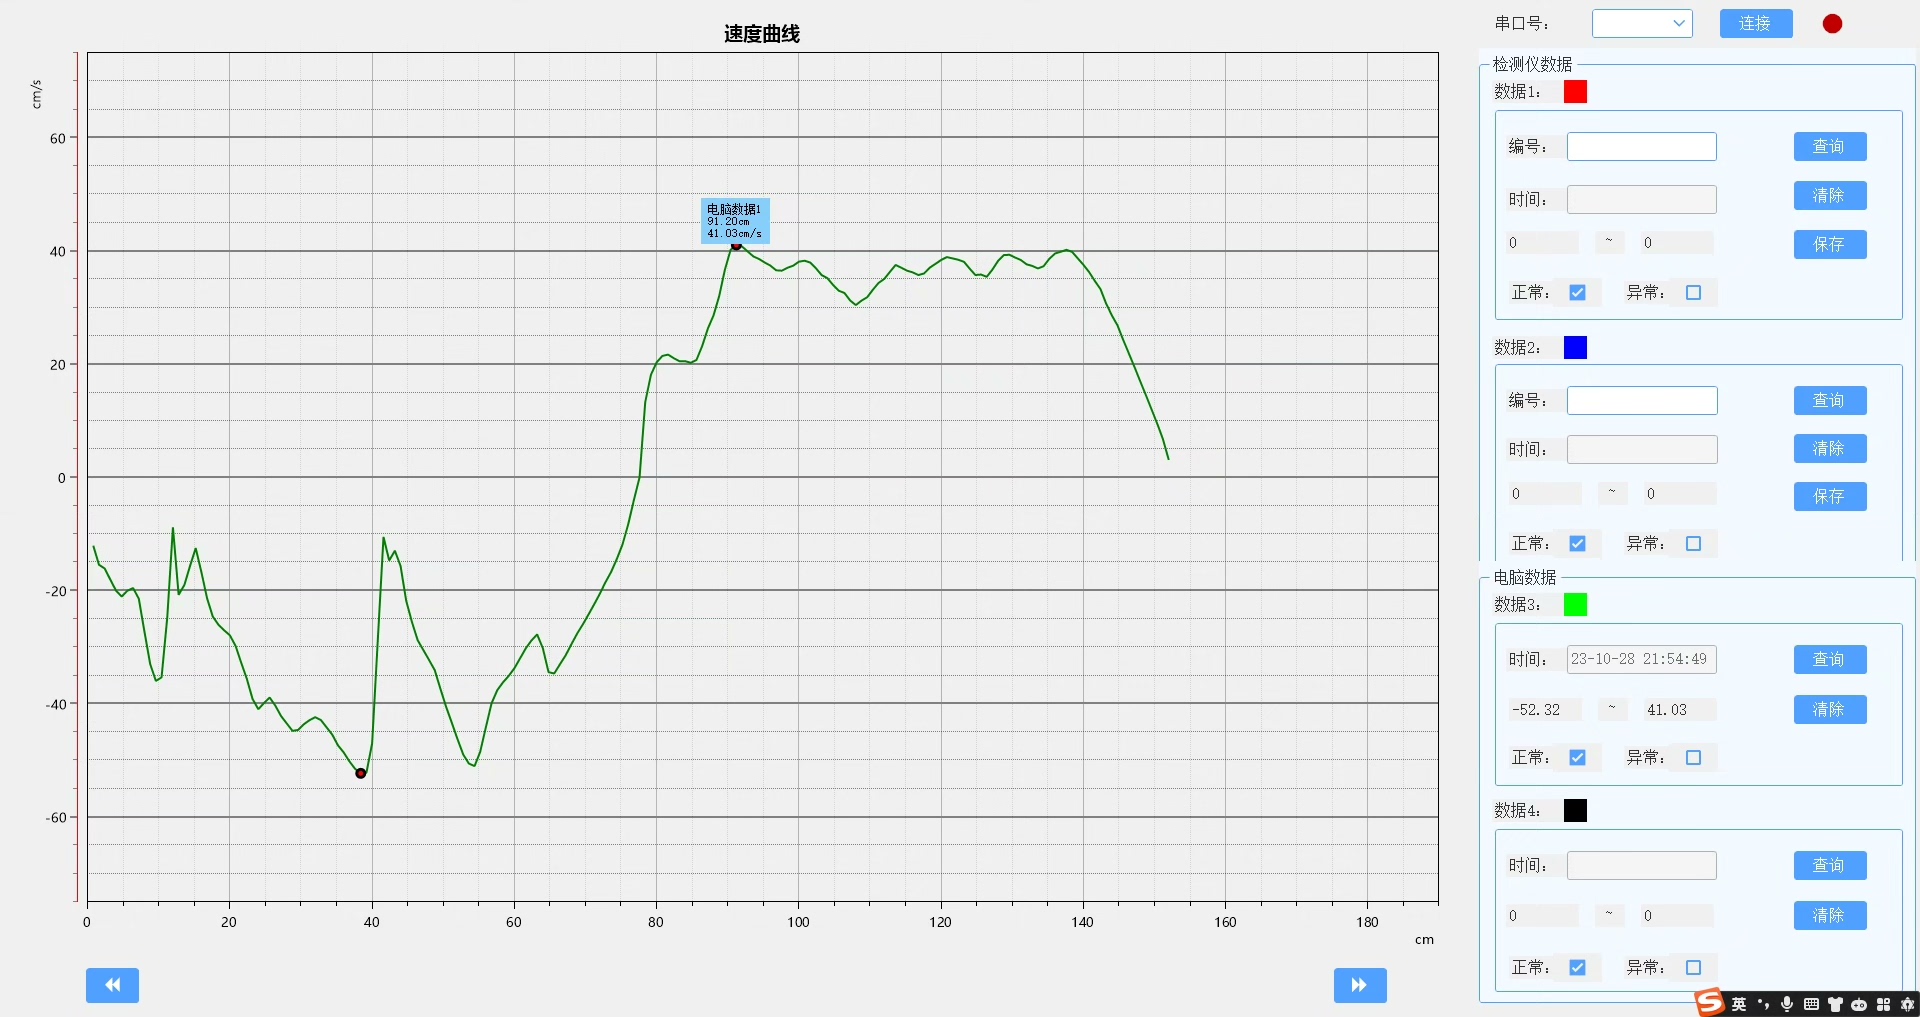
首先,在窗体上拖入一个Chart控件,命名为chart1。然后,当接收到数据时,将数据添加到曲线中:
private void AddDataToChart(double value)
{
    // 假设我们只有一条曲线,系列名称为 "Series1"
    chart1.Series["Series1"].Points.AddY(value);
}
显示多条曲线
如果要显示多条曲线,在初始化时可以添加多个系列:
private void InitializeCharts()
{
    chart1.Series.Add("Series1");
    chart1.Series["Series1"].ChartType = SeriesChartType.Line;

    chart1.Series.Add("Series2");
    chart1.Series["Series2"].ChartType = SeriesChartType.Line;
}
然后在接收到不同数据时,分别添加到对应的系列中:
private void AddDataToChart(int seriesIndex, double value)
{
    chart1.Series[seriesIndex].Points.AddY(value);
}
曲线交互操作:放大缩小与左右拖动
放大缩小
Chart控件本身提供了一些交互功能,我们可以通过设置ChartArea的AxisX和AxisY的属性来实现放大缩小。比如,当鼠标滚轮滚动时进行放大缩小操作:
private void chart1_MouseWheel(object sender, MouseEventArgs e)
{
    ChartArea chartArea = chart1.ChartAreas[0];
    double position = e.Location.X / (double)chart1.Width;
    double oldMin = chartArea.AxisX.Minimum;
    double oldMax = chartArea.AxisX.Maximum;
    double range = oldMax - oldMin;
    double newRange = range * (e.Delta > 0? 0.8 : 1.2);
    double newMin = oldMin + (range - newRange) * position;
    double newMax = newMin + newRange;
    chartArea.AxisX.Minimum = newMin;
    chartArea.AxisX.Maximum = newMax;
}
左右拖动
左右拖动可以通过记录鼠标按下和移动的位置来实现:
private Point mouseDownPoint;
private void chart1_MouseDown(object sender, MouseEventArgs e)
{
    mouseDownPoint = e.Location;
}

private void chart1_MouseMove(object sender, MouseEventArgs e)
{
    if (e.Button == MouseButtons.Left)
    {
        ChartArea chartArea = chart1.ChartAreas[0];
        double diff = (e.Location.X - mouseDownPoint.X) / (double)chart1.Width;
        double oldMin = chartArea.AxisX.Minimum;
        double oldMax = chartArea.AxisX.Maximum;
        double range = oldMax - oldMin;
        double newMin = oldMin - range * diff;
        double newMax = oldMax - range * diff;
        chartArea.AxisX.Minimum = newMin;
        chartArea.AxisX.Maximum = newMax;
        mouseDownPoint = e.Location;
    }
}
显示曲线最大最小值
在数据添加到曲线的过程中,我们可以实时记录最大最小值:
private double maxValue = double.MinValue;
private double minValue = double.MaxValue;
private void AddDataToChart(double value)
{
    chart1.Series["Series1"].Points.AddY(value);
    if (value > maxValue)
    {
        maxValue = value;
    }
    if (value < minValue)
    {
        minValue = value;
    }
    // 这里可以选择在界面上显示maxValue和minValue,比如通过Label控件
}
保存曲线并读取
保存曲线
我们可以将曲线的数据点保存到文件中,以简单的文本文件为例,每行记录一个数据点:
private void SaveChartData()
{
    string filePath = "chartData.txt";
    using (StreamWriter sw = new StreamWriter(filePath))
    {
        foreach (DataPoint point in chart1.Series["Series1"].Points)
        {
            sw.WriteLine(point.YValues[0]);
        }
    }
}
读取曲线
读取保存的数据并重新绘制曲线:
private void LoadChartData()
{
    string filePath = "chartData.txt";
    if (File.Exists(filePath))
    {
        chart1.Series["Series1"].Points.Clear();
        using (StreamReader sr = new StreamReader(filePath))
        {
            string line;
            while ((line = sr.ReadLine())!= null)
            {
                double value;
                if (double.TryParse(line, out value))
                {
                    chart1.Series["Series1"].Points.AddY(value);
                }
            }
        }
    }
}
通过以上步骤,我们就用C#实现了一个功能较为丰富的串口数据读取与曲线显示程序,涵盖了从基础串口通信到复杂曲线交互以及数据持久化的功能。希望这篇文章对你有所帮助,快去试试吧!

Agent 垂直技术社区,欢迎活跃、内容共建。
更多推荐


 4
4 0
0- 0


 已为社区贡献4条内容

所有评论(0)